The Tall Tower Report
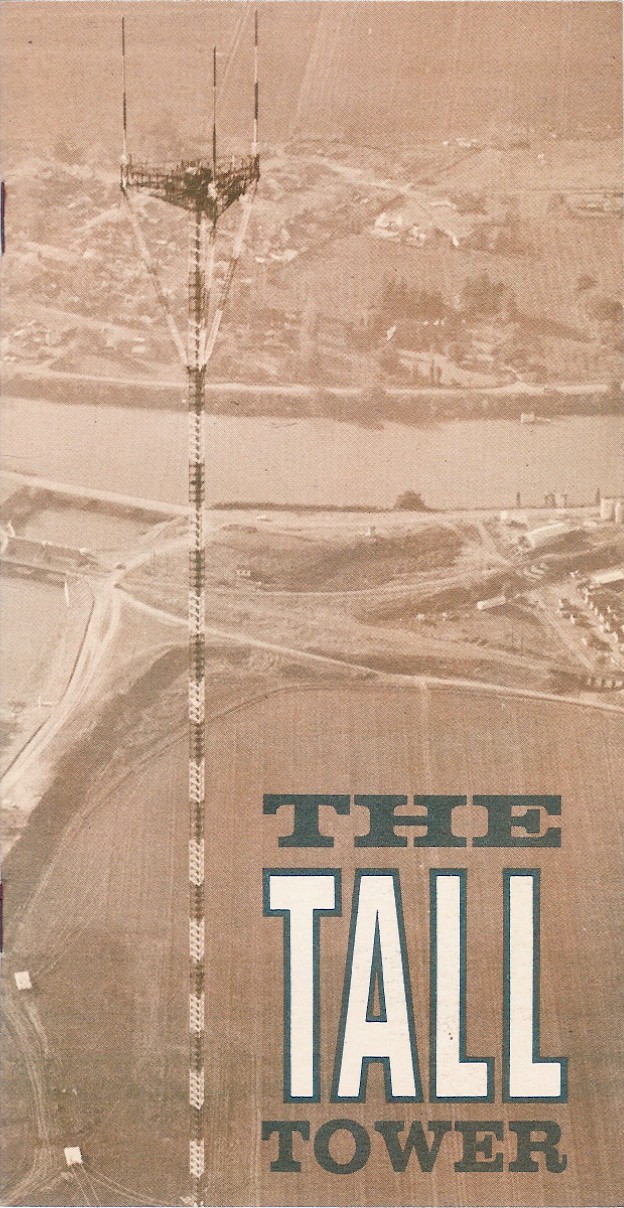
The Tall Tower Report
This report brings fourth new observations in NO2 maps taken by NASA's OMI satellite. It shows regions of NO2 in the direct vicinity of broadcast transmitters. It leads the reader to the conclusion that we need more research on this topic.
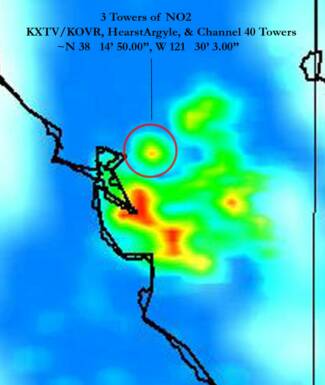
The 3 Towers of NO2
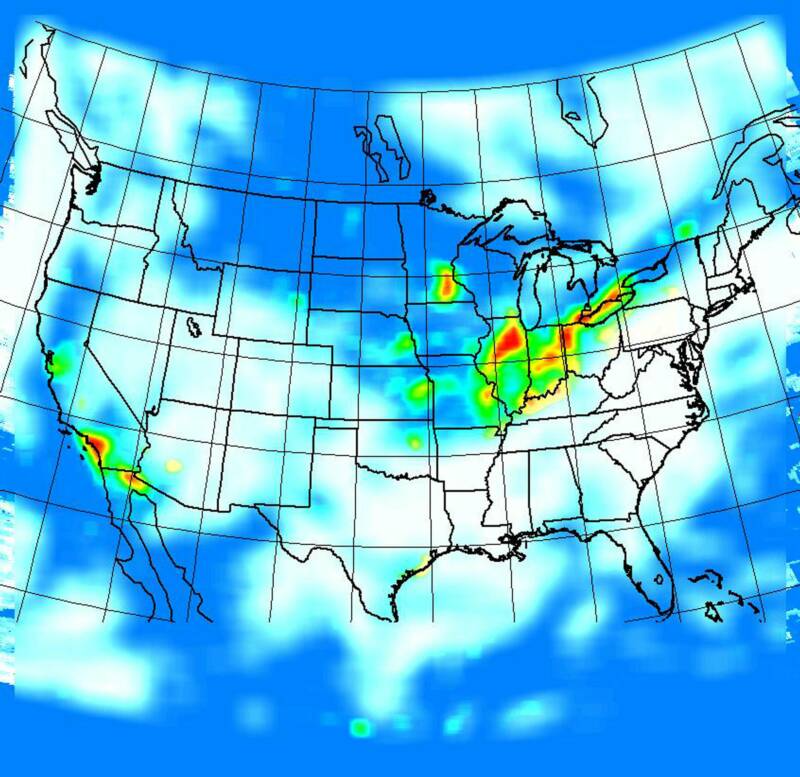
While going through NASA’s satellite images taken of NO2 in the California area, I was struck by an odd site. Most of the NO2 comes from the city and is most likely to be from CO2 from car emission, but I happened to notice a strange NO2 reading between San Francisco and Sacramento. It appeared to be a perfectly round spot of NO2? I wondered if it could be an actual NO2 signature from a broadcast tower. I realized that it would have to be away from the city to produce such a round signature. Well it turns out that it isn’t one, but three broadcast towers all in little Walnut Grove California with a total of 29.66MW!!
KXTV/KOVR & Hearst-Argyle Broadcast Tower Total ~ 30MW !!
The same amount of power explored in the China-Russia ionosphere heating experiments of 2018
"In the China-Russian experiment, researchers found that even with a small power output of 30MW, the radio beam could create a large abnormal zone. But they also found that the effects dropped sharply after sunrise, as the man-made perturbation easily became lost in the noise created by sunlight."
The studies collected in this report detailing HAARP experiments use 47MW in exploring the effects of radio frequencies in ionosphere heating. They show an increase of ion outflow in the cusp region and there is twice the amount of ion outflow that scientists can account for with current solar wind models. Where are all the extra ions coming from? Well I think this spot of NO2 points right to little Walnut California as a clue. And if this is true then we might be able to shut off global warming with the flick of a switch.
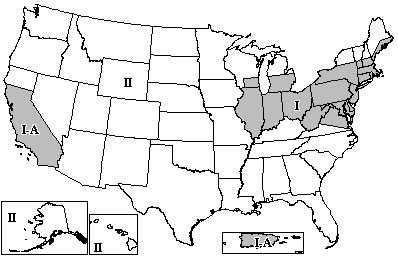
ERP too high in FM broadcasting zone 1
One thing of interesting note is NASA’s OMI satellite NO2 maps of the United States seems to look an awful lot like the FM broadcasting zones.In the United States, the maximum ERP for FM broadcasting is usually 100,000 watts (FM Zone II) or 50,000 watts (the more densely populated FM Zones I/I-A), though exact restrictions vary depending on the class of license. Some stations have been grandfathered in or, very infrequently, been given special dispensation, and can exceed normal restrictions.
It appears as though the ERP of 50kw is too high
for FM in Zone 1.
Just a suggestion.
Learn more about FM broadcasting
http://en.wikipedia.org/wiki/FM_broadcasting_in_the_USA
Learn more about the towers
http://www.fybush.com/sites/2005/site-051111.html
http://en.wikipedia.org/wiki/KXTV/KOVR_Tower
http://simple.wikipedia.org/wiki/List_of_the_world's_tallest_structures
https://www.scmp.com/news/china/science/article/2178214/china-and-russia-band-together-controversial-heating-experiments
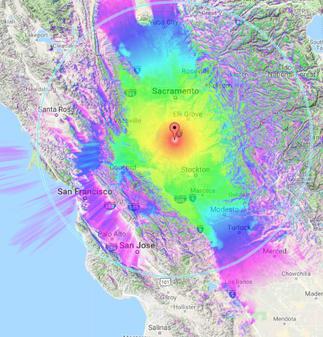
KOVR Tower Coverage Map
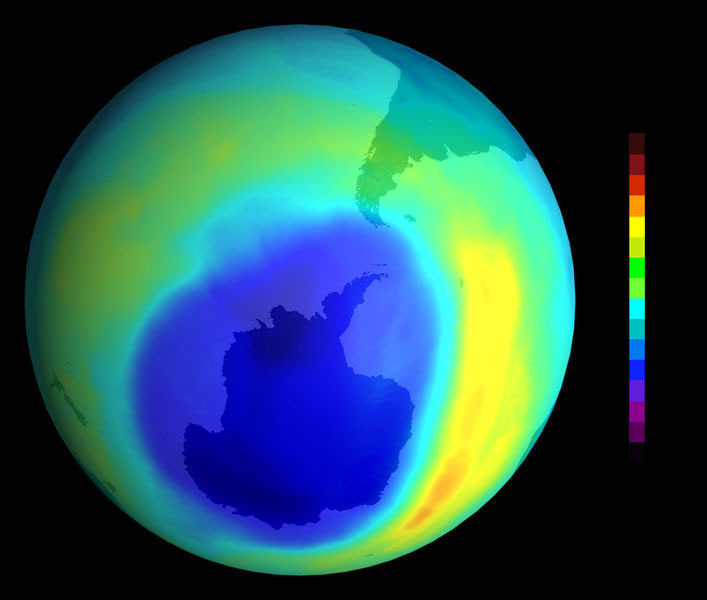
NASA OMI NO2 readings