Unify Global Warming Theories


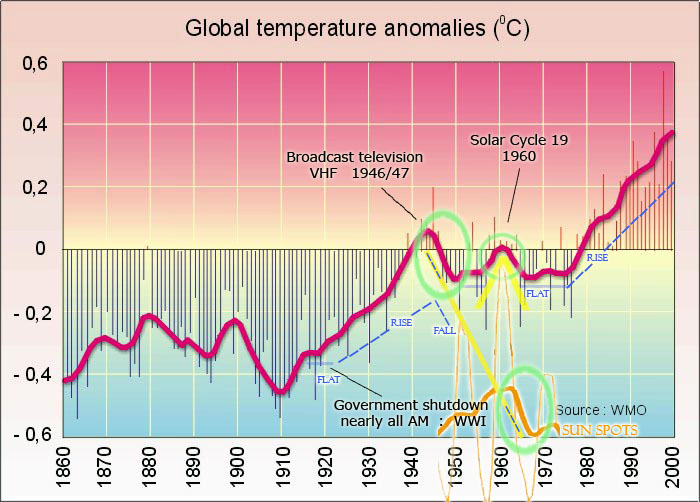
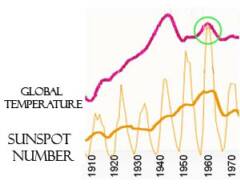
What caused the rise from 1910 - mid 40's?
 Broadcast energy traveled through the ionosphere to create electron precipitation in the northern polar region. These electron showers rain down to form NO2 which depletes ozone, our main defence against the suns powerful energy.
Why does the temperature drop in the 1940's ?
To understand the temperature drop in the fourties, you have to know that broadcasting above 2.75MHz (the 2nd harmonic of the gyro frequency) causes a suppression of the electron precipitation which is the main driver of stratospheric ozone depletion through NO2 production.
What caused the rise in the late 50's?
The rise in the 50's is closely correlated to a solar variance induced ozone depletion. The solar variance was caused by broadcast energy induced ion outflow that travels up the open magnetic field lines injecting O+ ions into the sun earth connection resulting in an increase in sunspot activity. See Broadcast Theory for more details on this complex process.
What caused the rise in the 70's?
Our current rise in temperature can be correlated to ozone depletion which leads to an increase in the greenhouse effect from solar evaporated water vapor (more) and CO2 (less). Ozone depletion is linked to CFC's and broadcast (electron precipitation)
How can broadcast cause global warming?
Click to go to
Frequency Heating
From looking at the global temperature, you can see the different kinds of heating that occur. These effects can be easily distinguished by a rounding of the temperature cycles as the sun is always in flux, but this is frequency induced heating, and once the temp was taken outside of its normal range it became very sensitive to its cause. So the natural sun flux is still way below the temperature line and no longer visible. There are parts of the five year mean temperature that level out and maintain, but that isn't possible with the flux of the sun and is a perfect example of frequency induced heating. This can be seen in the temperature graph and appears to follow our use of the gyro frequency.
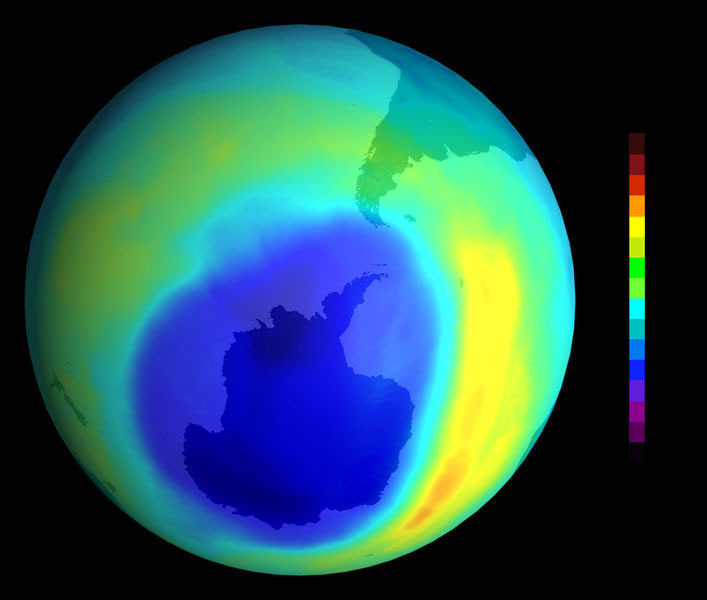
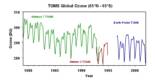
3 Ozone depletion levels
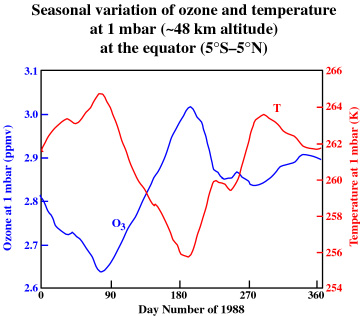
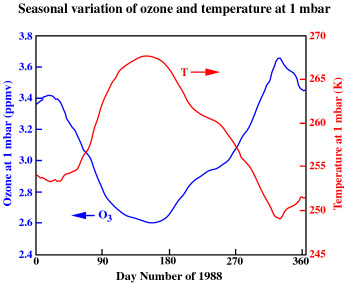
The 3 levels of global stratospheric ozone depletion are clearly visible in the global temperature showing a connection between the two. There are seasonal and solar variations in temperature that depend on the altitude of the stratosphere and the latitude.
Click to Enlarge
Learn more Ozone
Global Temperature Anomalies
3 Ozone level depletions correlate with the rise in temperature,1980-2000
---------------------------
A Revolutionary Perspective on Climate Alteration
1940's Temp Fall
Click to Enlarge
Click here to go Global Temperature Anomalies Graph source : Analysis of Secular Time Series of Climatological Characteristics