This was the birth of an idea that evolved into the Broadcast Theory of Climate Change.
Once I had traced the path of energy through the plasma physics experiments to electron precipitation, I learned that scientists had already found the mechanism nearly 30 years ago. The Swedish National Space Board and other atmospheric physicists had already raised concerns about satellite observations of ionospheric disturbances over areas of broadcast transmitters particularly in Europe and Asia. They warned about the possible effects it may have on the environment, yet broadcast continues to rise unmonitored and unregulated for these effects.
‘correlation does not imply causation’
In what direct ways can we see the climate mechanism being irregularly affected?
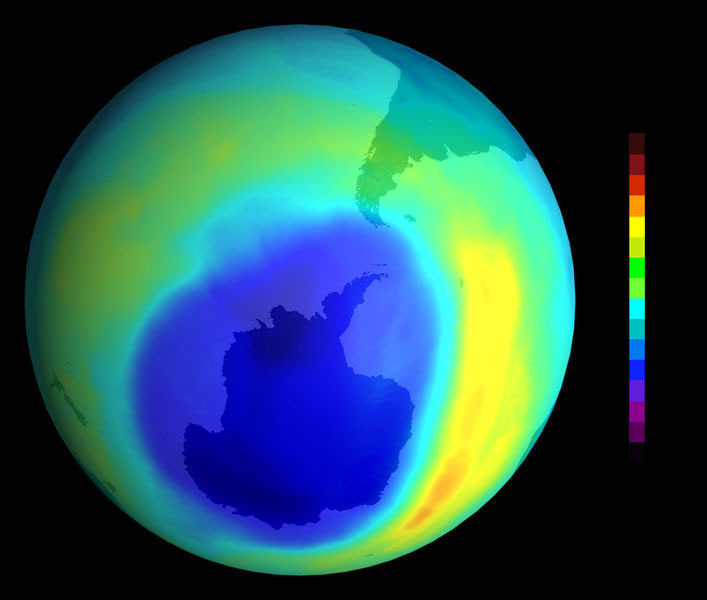
Ultimately the global temperature naturally changes and is most closely related to ozone levels. Ozone levels are regulated by NO2 and other ozone destroying chemicals in the atmosphere balancing the UV reactions that create ozone. The ozone layer regulates the amount of solar radiation heating the global oceans and causing evaporation. Water vapor forms clouds that reflect and absorb the suns heat, as well as remain the most abundant source of heat in the global greenhouse effect. The ozone levels have been depleting at about 4% per decade since 1980 and can be attributed to two distinct but related phenomena, the ozone holes over the polar regions and an over all depletion.
But why?
Through further research I learned that specific frequencies known as gyrofrequencies are major players in this process. Of these, the cyclotron frequency at 1.45 MHz (which falls in the AM broadcast band) and cyclotron maser 2.45 GHz drive fluctuations in electron precipitation. Our broadcast regulations are based on receiving quality, not the effects of gyrofrequencies on ozone depletion and ion outflow from the ionosphere. FCC’s allocation of radio frequencies doesn’t take this into consideration at all! The foundations of AM radio that go back 70 years have never changed. The FCC has no idea.
Abstract
This report will also show how broadcast energy may indirectly cause ozone depletion by affecting solar proton events, as broadcast generates density shifts of oxygen ions in the ionosphere and radio frequency heating that go up magnetic field lines toward the sun heating solar protons and changing solar-terrestrial flux tube morphology. Altering the rate of O+ gas flows in the convective zone of the sun forming sunspots which in turn throw ozone depleting energy back at earth.
Introduction & Abstract
Processing the Path
Research Collection
The research compiled for Broadcast Theory includes scientific documents spanning several fields of research from plasma physics, antenna engineering, FCC technical specs, gravity maps and much more. It was organized for easy reference according to process starting with reports on humans impact on the space plasma environment and the effects of radio waves on the atmosphere to the history of broadcast. It took three months of in depth intensive research to bring all this information together. Ever since I noticed the possibility that radio could be a factor in global climate change I knew I could not find peace until I had done all that I could to discover it's secrets and get it into the right hands in the most effective way possible.
Broadcast Theory
Contents
Excerpt Swedish National Space Institute http.//www.physics.irfu.se/Objectives/
Intro & Abstract
My Story
Processing the Path of Energy
Path of Energy
Global Temperature Anomalies: Source WMO
Science Daily Fact: 1400 kHZ Gyro frequency http.//www.lofar.org/science/urd100/Ionosphere_passive.html
Radio Frequencies and their effect on the Environment
Plasma Physics with the EISCAT HF Ionospheric Heating Facility
Monitoring of the Electromagnetic Fluctuations from Industrial Sources
http://ej.iop.org/links/r6NIbl0Rn/fNtCA9QZ3BGNEtvCav5vpA/jpconf6_48_219.pdf
Ionospheric disturbances generated by different natural processes and by human activity in Earth plasma environment http://www.earth-prints.org/bitstream/2122/823/1/18Rothkaehl.pdf
Highlights page for the above
Swedish Institute of Space Physics :Studies of Electromagnetic Radiation in Space http://www.physics.irfu.se/Objectives/
Highlights page for the above
Atmosphere-Ionosphere Mission http://www.physics.irfu.se/Nanny/AIMelaborate.pdf
Highlights page for the above
Environmental Impacts of Electromagnetic Fields From Major Technologies - WHO
http://www.who.int/peh emf/publications/reports/en/env_impact_emf_from_major_elect_tech_foster_repacholi.pdf
Environmental Impact of high power density microwave beams on different atmospheric layers http://www.esa.int/gsp/ACT/doc/ARI/ARI%20Study%20Report/ACT-RPT-NRG-ARI-04-9102-Environmental_impacts_of%20microwave_beams-Report.pdf
Phenomena in the ionosphere-magnetosphere system induced by injection of powerful HF radio waves into nightside auroral ionosphere http://www.ann-geophys.net/23/87/2005/angeo-23-87-2005.pdf
The geometrical characteristics of HF-Induced plasma wave phenomena http://www.ursi.org/Proceedings/ProcGA05/pdf/HG2.8(01554).pdf
Gyrofrequency Multiples and the Luxembourg effect
Topband: gyro frequency http://lists.contesting.com/archives//html/Topband/2001-04/msg00072.html
The 160-Meter Band: An Enigma Shrouded in Mystery http://www.spacew.com/cq/cqmar98.pdf
KN4LF 160 Meter Radio Propagation Theory Notes http://www.kn4lf.com/kn4lf8.htm
Modification of the F region by powerful radio waves http://adsabs.harvard.edu/abs/1981epua.proc...83S
Role of the ionosphere in the propagation of geomagnetic pulsations http://adsabs.harvard.edu/abs/1986Ge&Ae..26..640S
New electron gyroharmonic effects in HF scatter from pump-excited magnetic field-aligned ionospheric irregularities http://www.agu.org/pubs/crossref/1999/1999JA900039.shtml
Laboratory modeling of nonlinear trapping of Langmuir waves inside a small-scale magnetoplasma irregularity http://www.cosis.net/abstracts/COSPAR2006/00544/COSPAR2006-A-00544.pdf?PHPSESSID=6ef5be235b364fecfdfba6d3c17b2a5a
Artificial optical emissions at HAARP for pump frequencies near the third and second electron gyro-harmonic http://www.ann-geophys.net/23/1585/2005/angeo-23-1585-2005.pdf
An effect of neutral collisions on the excitation threshold of electrostatic ion-cyclotron waves http://flux.aps.org/meetings/YR98/BAPSDPP98/abs/S2500026.html
Electrostatic electron cyclotron waves observed by the plasma wave instrument on board Polar http://adsabs.harvard.edu/abs/2001JGR...106.6043M
Theory of the current-driven ion cyclotron instability in the bottomside ionosphere http://stinet.dtic.mil/oai/oai?&verb=getRecord&metadataPrefix=html&identifier=ADA161862
First results from the Radio Plasma Imager on IMAGE http://www.agu.org/pubs/crossref/2001/2000GL012398.shtml
Observation of topside ionospheric MF/HF radio emission from space http://sprg.ssl.berkeley.edu/adminstuff/webpubs/1999_grl_667.pdf
5 ionospheric aplications for LOFAR http://www.lofar.org/science/urd100/Ionosphere_passive.html
The magnetized electron-acoustic instability driven by a warm, field-aligned electron beam http://adsabs.harvard.edu/abs/2004PhPl...11.1996S
Session F3S - Poster Session: Space and Astrophysical and Astrophysical Plasmas http://flux.aps.org/meetings/YR98/BAPSDPP98/abs/S2500.html
POLAR AERONOMY AND RADIO SCIENCE (PARS) ULF/ELF/VLF PROJECT
http://www-star.stanford.edu/~vlf/pars/pars.htm
Highlights page for above
Luxembourg effect on 24 MHz in connection with strong aurora http://adsabs.harvard.edu/abs/1977KlBer..20..183H
Experiment Luxembourg: Cross modulation at high lattitude, low hieght http://ieeexplore.ieee.org/xpl/freeabs_all.jsp?arnumber=1137921
Thermal Self-focusing instability in the high-latitude ionosphere http://www.agu.org/pubs/crossref/2003/2003RS002906.shtml
Interaction between the Polar Ionosphere and Thermosphere
http://www.iop.org/EJ/abstract/1402-4896/1987/T18/026
Polarization of Auroral Radio Emissions http://engineering.dartmouth.edu/spacescience/pol.html
Behavior of linear beam-plasma instabilities in the presence of finite amplitude circularly polarized waves http://www.scielo.br/scielo.php?pid=S0103-97332004000800009&script=sci_arttext
Wave intensifications near the electron cyclotron frequency within the polar cusp http://www.agu.org/pubs/crossref/1990/89JA03497.shtml
Amplification of electrostatic ion-cyclotron waves in a plasma with magnetic-field-aligned ion flow shear and no electron current http://adsabs.harvard.edu/abs/2004PhPl...11.4501K
Structure and dynamics of the Earth's polar ionosphere: recent results inferred from incoherent scatter sounders
http://www.iop.org/EJ/abstract/0963-0252/11/3A/317
Power absorption of high-frequency electromagnetic waves in a partially ionized magnetized plasma http://ej.iop.org/links/rvrPGx1b3/hjUoUuEZ3BGbQymEav5vpA/pst_7_1_010.pdf
The electron cyclotron instability and high-frequency ionization on a beam-plasma experiment http://www.iop.org/EJ/abstract/0032-1028/10/12/303
Wave propagation across ion cyclotron resonance harmonic layers
http://www.iop.org/EJ/abstract/0741-3335/31/8/003
Polar Cusp
Polar Scientists Find UNexpected Energetic Ions in the Earth's Magnetic Cusp http://pwg.gsfc.nasa.gov/istp/polar/2001jan.html
The kinetic shell model of coronal heating and acceleration by ion cyclotron waves 1,2 & 3 http://www.springerlink.com/content/xq65740r07w5084v/
On ion-cyclotron-resonance heating of the corona and solar wind http://www.cosis.net/members/onlib/request.php?file=EGU/NPG/2003/1/npg-10-101.pdf
Ionospheric ion upwelling in the wake of flux transfer events at the dayside magnetopause http://www.agu.org/pubs/crossref/1988/88JA01158.shtml
Simultaneous EISCAT Svalbard radar and DMSP observations of ion upflow in the dayside polar ionosphere
http://www.agu.org/pubs/crossref/2003/2002JA009590.shtml
The cusp and the cleft/boundary layer: Low-altitude identification and statistical local time variation http://www.agu.org/pubs/crossref/1988/88JA03437.shtml
Ion outflow and associated perpendicular heating in the cusp observed by Interball Auroral Probe and Fast Auroral Snapshot http://sprg.ssl.berkeley.edu/adminstuff/webpubs/2002_jgr_A2_4.pdf
Particle Acceleration and Wave Phenomena in the Auroral Region http://ham.space.umn.edu/~bob/alfvenconfintro.pdf
Wave particle interactions in the high-altitude polar cusp: a Cluster case study
http://www.ann-geophys.net/23/3699/2005/angeo-23-3699-2005.pdf
Polar observations of electron density distributions in the Earth's magnetosphere
http://ssed.gsfc.nasa.gov/PolarEFI/publications/laakso_ag01194.pdf
Latitudinal variation of the electron density over the northern polar cusp from RPI/IMAGE observations
http://adsabs.harvard.edu/abs/2003AGUFMSM12A1201N
Ozone
Investigation of Electronegativity in RF Xe/SF_6 Inductively Coupled Plasma using a Langmuir probe
http://flux.aps.org/meetings/YR01/GEC01/abs/S140.html
Resonances in collisions of low-energy electrons with ozone: Experimental elastic and vibrationally inelastic differential cross sections and dissociative attachment spectra http://adsabs.harvard.edu/abs/1996JPhB...29.4727A
A scaling analysis of ozone photochemistry http://www.atmos-chem-phys.net/6/4067/2006/acp-6-4067-2006.pdf
Electronegativity of low-pressure high-density oxygen discharges
http://www.iop.org/EJ/abstract/0022-3727/34/7/312
Observations of mesospheric ozone depletion during the October 28, 2003 solar proton event by OSIRIS
http://www.agu.org/pubs/crossref/2005/2004GL021521.shtml
Stratospheric effects of energetic particle precipitation in 2003-2004 http://darc.nerc.ac.uk/asset/GRL_randall_final.pdf
Gigantic solar storms slash ozone levels http://www.newscientist.com/article.ns?id=dn7088
A search of UARS data for ozone depletions caused by the highly relativistic electron precipitation events of May 1992 http://www.agu.org/pubs/crossref/1999/1998JA900030.shtml
Mesospheric constituent variations during electron precipitation events http://adsabs.harvard.edu/abs/1999JGR...10426457A
Mesospheric ozone depletion due to energetic electron precipitation at the South Atlantic magnetic anomaly
http://adsabs.harvard.edu/abs/1990AnGeo...8..365P
Energetic Radiation Belt Electron Precipitation: A natural Depletion mechanism for Stratospheric ozone
http://adsabs.harvard.edu/abs/1977Sci...195..287M
NASA Ozone Resource Page http://www.nasa.gov/vision/earth/environment/ozone_resource_page.html
NASA - Aura Sheds New Light on Air Quality and the Ozone Hole http://www.nasa.gov/vision/earth/lookingatearth/aura_first2.html
Broadcast History
How does this relate to broadcast history?
Gravity Maps and the Sohern Current
US/UK World Magnetic Chart http://www.ngdc.noaa.gov/seg/WMM/data/wmm-D05.pdf
Discover Magazine March 2007, Gravity Maps
Start of Television Services, External Radio Broadcasting, UK radio licences, UK television licences
http://www.terramedia.co.uk/index.htm
VHF & UHF Frequency Allocation http://en.wikipedia.org/wiki/Radio_spectrum
History of Radio http://en.wikipedia.org/wiki/History_of_Radio
Building the Broadcast Band http://www.oldradio.com/archives/general/buildbcb.html
100 Years of radio broadcasting http://www.californiahistoricalradio.com/100years.html
What ever happened to Channel 1? http://www.tech-notes.tv/History&Trivia/Channel%20One/Channel_1.htm
FM broadcasting http://en.wikipedia.org/wiki/FM_broadcasting
AM Broadcasting http://en.wikipedia.org/wiki/AM_broadcasting
Extended AM broadcast band http://en.wikipedia.org/wiki/Extended_AM_broadcast_band
Mediumwave http://en.wikipedia.org/wiki/Mediumwave
Earliest FM Radio Stations http://members.aol.com/jeff560/fmfirst.html
The Most Powerful FM Stations http://members.aol.com/jeff1070/fm-max.html
Radio Highlights and Headlines: 1946 http://members.aol.com/jeff560/1946news.html
Commercial Television Stations in the U.S. as of Mar. 1, 1947 http://members.aol.com/jeff99500/1947tvalloc.html
Transmitter http://en.wikipedia.org/wiki/Transmitter
Ionospheric irregularities due to powerful HF radio transmissions http://adsabs.harvard.edu/abs/1989isvg.agarR....F
Considering the Service zone of a powerful transmitter broadcasting in kilometric waves http://adsabs.harvard.edu/abs/1982mlvl.agarT....F
Diagnosis of ionospheric radiowave propagation conditions via monitoring of shortwave broadcast signals
http://www.ips.gov.au/IPSHosted/NCRS/wars/wars2000/commg/anderson_abs.pdf
Voice of Russia http://en.wikipedia.org/wiki/Voice_of_russia
Warsaw radio mast http://en.wikipedia.org/wiki/Warsaw_radio_mast
Allouis longwave transmitter http://en.wikipedia.org/wiki/Allouis_longwave_transmitter
Taldom transmitter http://en.wikipedia.org/wiki/Taldom_transmitter
Transmitter Roumoules http://en.wikipedia.org/wiki/Transmitter_Roumoules
Roumoules broadcast coverage maps
Radio Monte Carlo http://en.wikipedia.org/wiki/Radio_Monte_Carlo
WWCR http://en.wikipedia.org/wiki/WWCR
KTGF http://en.wikipedia.org/wiki/KTGF
KTGF broadcast coverage maps from FCC
TV-FM DX http://en.wikipedia.org/wiki/TV-FM_DX
HF Propagation Tutorial http://www.astrosurf.com/luxorion/qsl-hf-tutorial-nm7m.htm
LORAN-C
LORAN-C HISTORY http://jproc.ca/hyperbolic/loran_c_history.html
Diagram of LORAN_ C transmitters around gravity anomoly Gillette Wyoming mast
LORAN-C Chain United States coverage map
Lower ionospheric sounding by the use of Loran-C Signals http://adsabs.harvard.edu/abs/1974JGG....26..511I
Simultaneous measurments of intensities and phase of Loran-C waves http://adsabs.harvard.edu/abs/1974RaRLJ..21..443O
LORAN http://en.wikipedia.org/wiki/LORAN
Is Wyoming’s Tallest Structure a Dormitory or a Coast Guard Tower Aimed at Helping Great Lakes Navigation?
http://americasroof.com/wp/archives/category/tallest-buildings/
Tower outside Gillette sets Wyo record http://www.casperstartribune.net/articles/2005/03/10/news/wyoming/eff43d9ec654f64887256fbf006ce6fc.txt
Frequency Standards: Loran-C http://www.thinksrs.com/products/FS700.htm
Very Low Frrequency (VLF) Stations http.//www.smeter.net/stations/vlf-stations.php
LORAN-A http://jproc.ca/hyperbolic/loran_a.html
The LORAN Chains in WWII http://jproc.ca/hyperbolic/lora_ww2chains.html
Auroral Electrojet Research Studies http://www-star.stanford.edu/~vlf/ejet/electrojet.html
Click here to add text.
Click here to add text.
Click to Enlarge
The main book contains the bulk of all the research done, it contains many abstracts and full reports as well as scientific experiments and resource information. There is a brief edition that only has the abstracts and first page of the full reports. The Tall Tower Report became a report of it's own separate from the main book. It contains observations I have made from NASA's OMI satellite readings of global NO2 including FCC technical Specs as well as transmitter coverage maps.

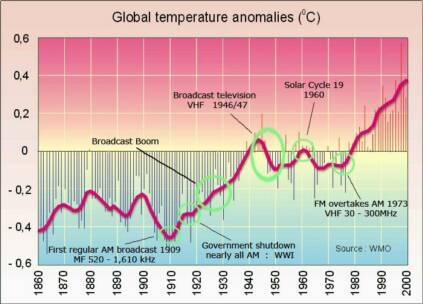
1909 The temperature started its first apparent rise with the first regular AM broadcast.
1917 -19 Here on the temperature graph there is a flat line, during this time the government shut down nearly all AM broadcast because of WWI.
1920 - 25 After war restrictions were lifted the first radio broadcast boom occurred the temperature quickly began to climb.
1946/47 As television broadcast boomed there was a massive drop in global temperature that flattened out in 1951.
1973 It wasn't until FM radio began to overtake AM that the temperature began its final and current rise.
...is there a connection?
Next click here
Click to Enlarge


Research Sections
Processing the Path
Next click here
Processing the Path
Next click here