Polar Regions & Solar Variance
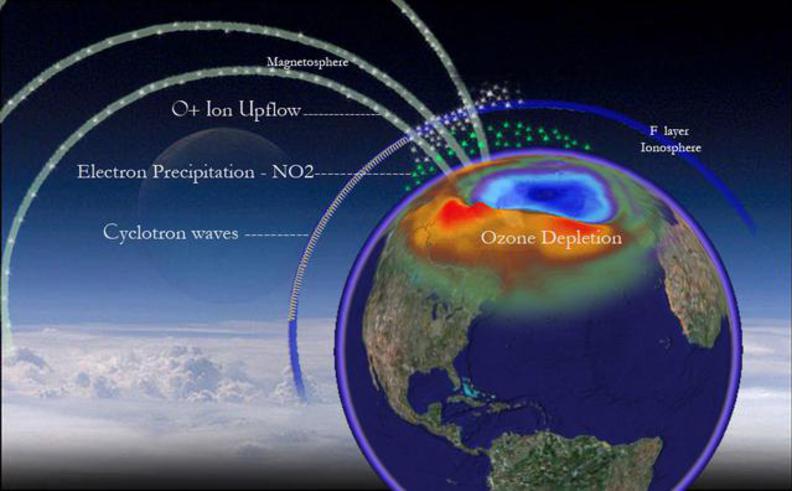
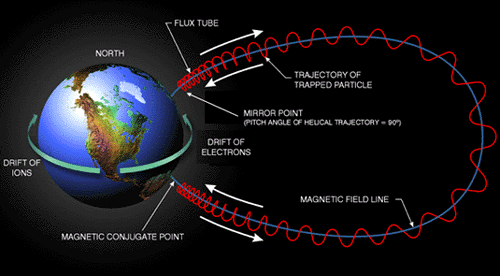
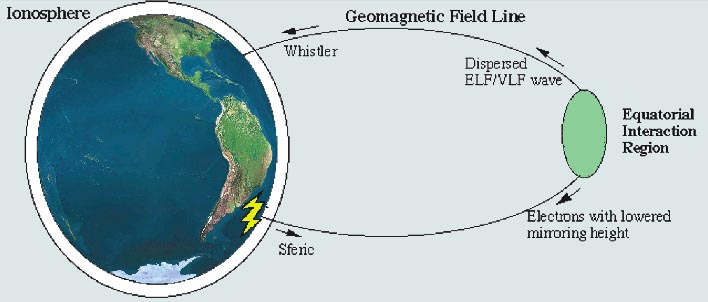
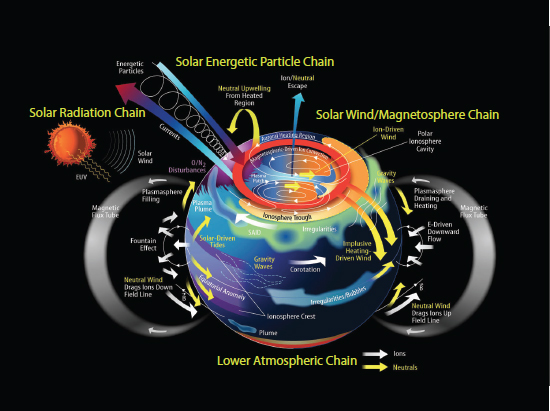
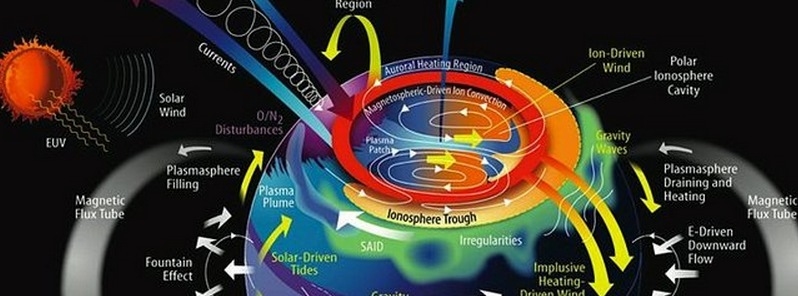
As we look into the polar regions we can see this complex system of electrical rivers and particle streams. The EIC waves travel as an electron beam spiraling along the magnetic field lines with O+ and H+ ions that flow to the polar regions where they cause shifts in polar ion density altering flux tube morphology along Interplanetary Magnetic Field (IMF) lines and cause ions to flow up the closed field lines of the radiation belt. The magnetic field lines come down upon the ionosphere as flux tubes in which the ions flow up and a charge exchange occurs causing electrons to precipitate down in what is called a Flux Transfer Event FTE
“the outflow from the ionosphere is two orders of magnitude greater than predicted for the “classical” polar wind” - in the wake of the Flux Transfer Events (FTE’s) on the dayside magnetopause. Click to go to
Could it be that this extra ion outflow is coming from radio broadcast towers transmitting in the VLF and gyro-frequency range? Considering the dynamics involving the particle transfer across the magnetic field lines and the ionosphere, it may be that the wave intensifications crossing the flux tubes in the ionosphere decrease the perpendicular force, which the particles trapped by the magnetic field lines rely on to mirror them back along the field line to the opposite southern pole. This changes the pitch angle diffusion of particles entering the polar cusp. In this wave crossing the perpendicular force is decreased allowing more of these particles to interact with our atmosphere and increase the amount of electron precipitation to the loss cone of the polar vortex in polar regions.
R E P- Relativistic Electron Precipitation
“The high altitude polar cap is generally one of the most tenuous regions of the magnetosphere, but surprisingly, the polar densities are very high, several 100 cm-3, and interestingly, the density peaks at the central polar cap.”
Flux decrease events usually begin in the pre-midnight sector (1500-2400 MLT), and typically show decreases of around 3 three orders of magnitude in >2 MeV electron flux within a few hours of onset, followed by an extended period of low flux suggesting permanent electron loss... Precipitation into the atmosphere of electrons driven into the bounce loss cone was suggested as the primary loss mechanism, through interaction with electron cyclotron harmonic waves [Horne and Thorne, 2000], electromagnetic ion cyclotron waves [Summers and Thorne, 2003], whistler waves [Horne and Thorne, 2003], separately or in combination. Click & go
Theory for the electron precipitation and current system that produces a magnetospheric substorm
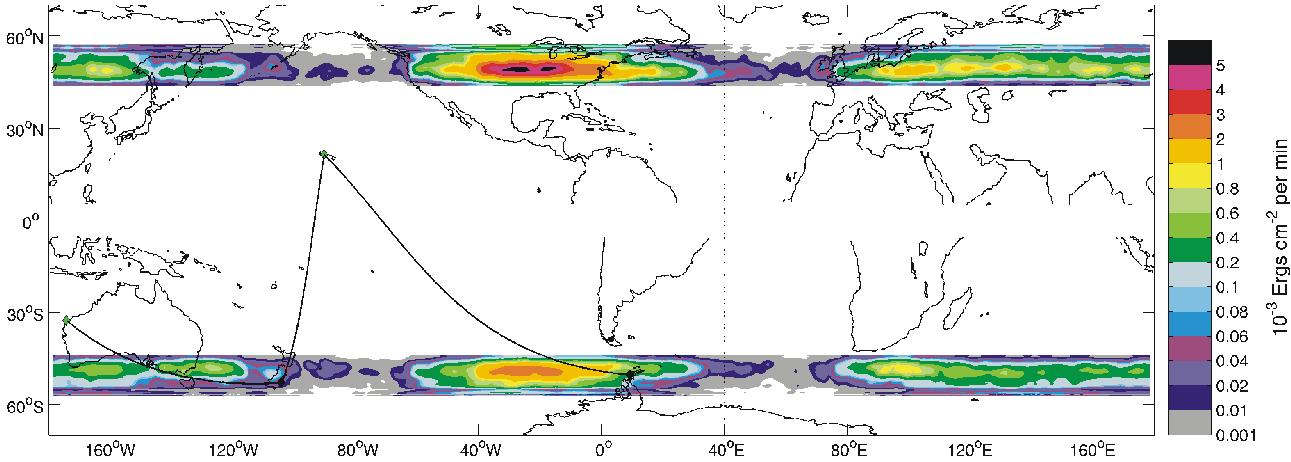
Whistler induced electron precipitation occurs in regions of . The main driving mechanism for whistler mode waves is lightning and VLF transmitters. These whistler mode waves travel from the polar regions so what you are looking at are rivers and streams of particles and charges being fuelled by broadcasting charged energy into the atmosphere through the gyro frequency as well as a host of other frequencies. These frequencies reflect off and bounce around in the blanket of electricity called the ionosphere magnetosphere coupling and create ozone depleting NOx. with the northern hemisphere being almost twice that for the southern hemisphere and the strongest energy inputs occur over North America the largest radio polluters.
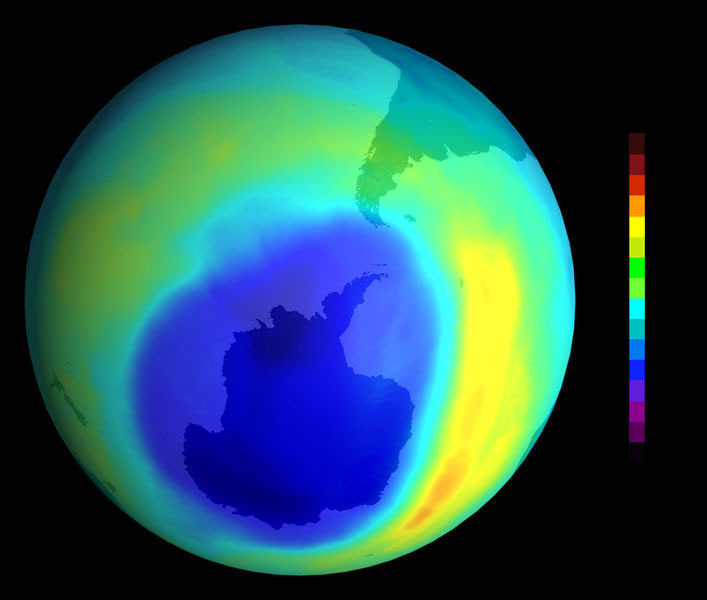
The last section will look at the possible ramifications of an increase in electron density at the polar region. We will look at the effects on the electro-negativity, cosmic ray collisions within the ozone layer, and the reactions with nitrogen forming nitrogen oxide that rips apart ozone molecules just like CFCs.
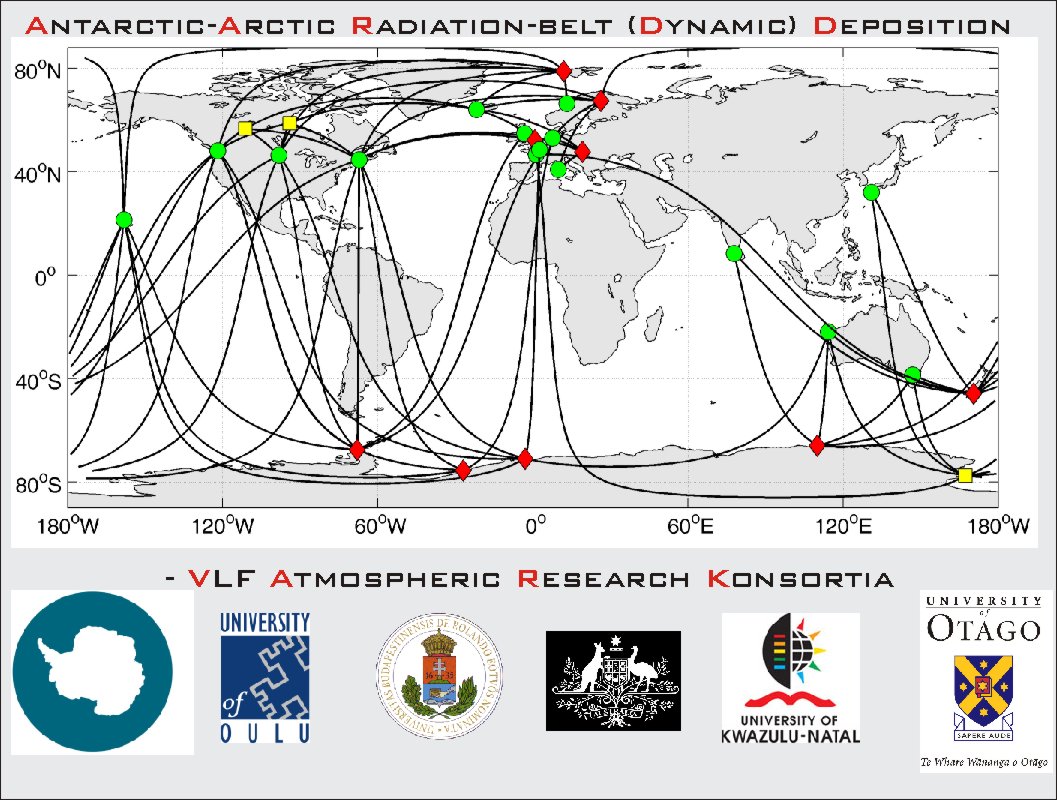
AARDVARK
Relativistic Electron Precipitation (REP)


Decent of NOx from Thermospheric Altitudes
Background Material
Click to Enlarge
Whistler induced Electron Precipitation (WEP)
WEP Schematic.
WEP Deposition
Click to Enlarge
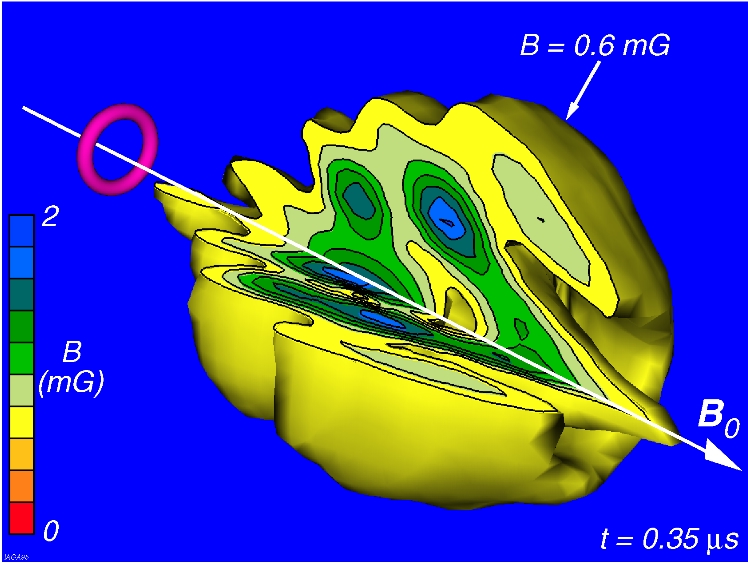
Whistler Wave Packet
- NOx
Solar Cycle 23 Project: Summary of Panel Findings
The prediction technique based on the empirical result that odd-numbered cycles are larger than their preceding cycle, suggests that the next cycle will exceed Cycle 22 and could be larger than Cycle 19. The general trend of cycle amplitudes is also increasing; recent cycles have been large (see Figure 1). Based on such an analysis, there is a reasonable probability that Cycle 23 will equal, or exceed, Cycle 19. This does not, however, consider the observed conditions that are the basis of the precursor technique. The conditions presently being observed in the Sun-Earth environment are not consistent with those observed prior to Cycle 19 and do not support the idea that Cycle 23 will be as large as Cycle 19.
New sunspot cycle to be bigger than average
In turn, this serves as a good indicator of where the sunspot cycle is headed, but it's not an absolute measure. Hathaway has several graphs showing different prediction methods applied to past sunspot cycles. That is, they used the data from early in a cycle to "predict" what the rest of the cycle would do. Most predictions match reality fairly close, except for Cycle 19, the current record cycle, which peaked at 190 in sunspot number in 1957, just as the first space physics satellites were being launched.

Click here to add text.
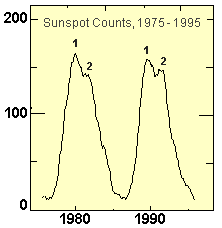
Solar Cycle 19 ~ (1958-60)
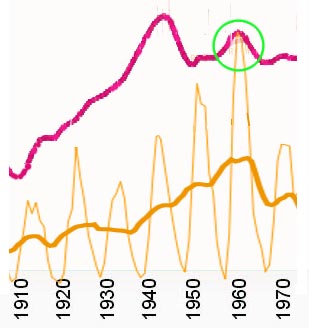
This solar cycle was the largest sunspot cycle on record peaking in March of 1958 and ever since our cycles have been out of wack with double peaks appearing since 2000. The cyclotron maser waves have been observed heating particles to high temperatures well into the sun earth connection and have been atributed to a depression in the sun's photosphere.
During solar maximum, magnetic fields above the Sun's surface become impressively tangled, particularly near sunspots. Twisted magnetic fields -- stretched like taut rubber bands -- can snap back and explode, powering solar flares and coronal mass ejections. Sunspots are the most visible sign of those complex magnetic fields -- but not the only one. Another sign is solar radio emissions, which come from hot gas trapped in magnetic loops. "The radio Sun is even brighter now than it was in 2000," says Hathaway. By the radio standard, this second peak is larger than the first. Hathaway notes a widespread misconception that solar activity varies every 11 years "like a pure sinusoid." In fact, he says, solar activity is chaotic; there is more than one period.Earth-directed solar explosions, for instance, tend to happen every 27 days -- the time it takes for sunspots to rotate once around the Sun. There is also an occasional 155-day cycle of solar flares. No one knows what causes it. And the double peaks of recent solar maxima are separated by approximately 18 months. Click for Source
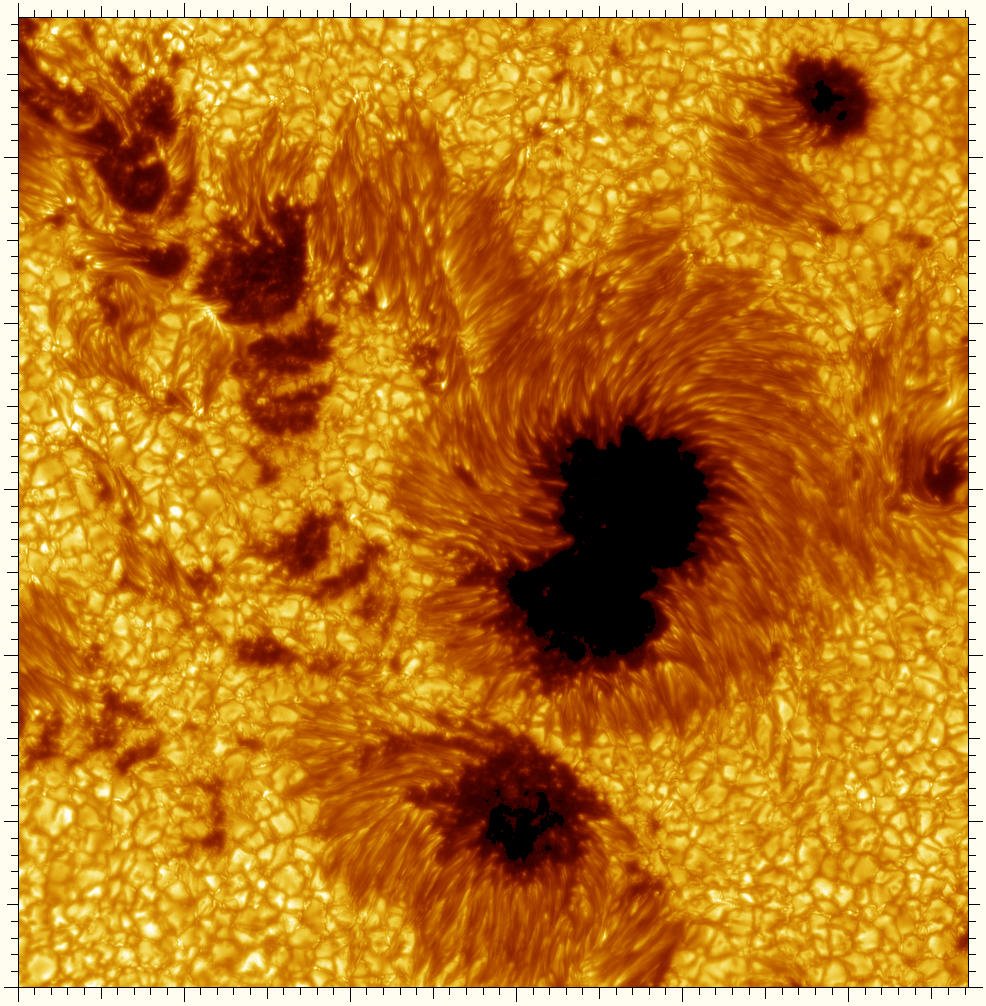
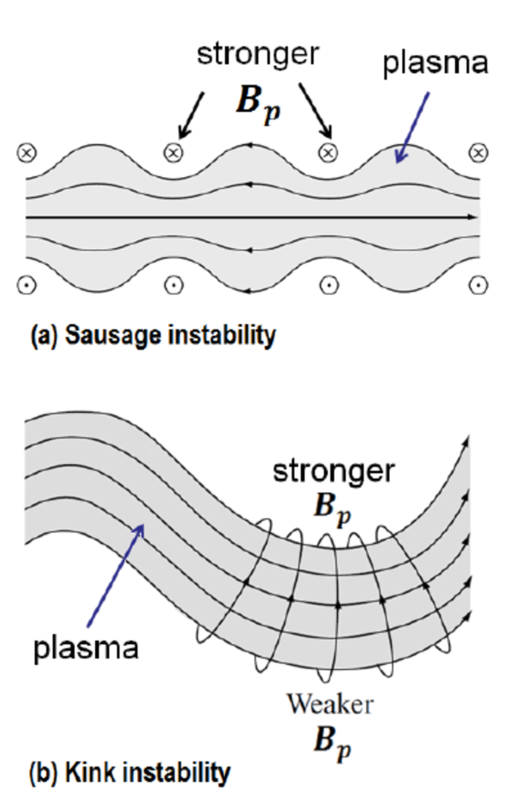
In 1960 Kunzel first coined the "delta" - sunspot which are driven by a kink instability in the magnetic flux tube near the suns photosphere, these sunspots exhibit different characteristics than regular sunspots. The kink instability may be caused by a convection effect in the edge of the magnetic flux tube generated by cyclotron maser particle heating particularly protons are sensitive to this as well as magnetosonic waves.. The polarity differential in the photosphere spots may be a result of a charge imbalance causing an increase in electron charge transfer to equalize the ion upflow just as CME Coronal mass ejections squeeze ions out of our magnetotail to reconnection. It may be that the first peak seen in recent double peaked cycles is actually cyclotron induced backscatter off the photosphere (due to charge imbalance) that cause the kink instability to form. It may be that deltas weren't noticed before the 60's because there were none and this is a recent phenomena. It is difficult to think that we may impact the sun, but the sun has an electromagnetic balance with each planet in its system and a certain amount of energy is given and received along these lines electrically. If you change the overall charge of the polar cap say more O+ creates more + polarity, this balance could play out along the magnetic field lines that connect this region to the sun.
Last year, scientists using a technique called helioseismology, which can probe conditions within the Sun much like seismic waves reveal the interior structure of our planet, announced that currents of gas at the base of the convective zone speed and slacken every 16 months. "That's about the same as the time between the double peaks of recent solar maxima," notes Hathaway. Perhaps the two are connected. "It's hard to be sure," he cautions, because the detailed inner workings of stellar magnetic dynamos remain a mystery. "Helioseismology of the Sun, which can probe beneath its visible surface, is still a young field. We need more time to understand completely how the internal rhythms of our star affect the solar cycle.
The kink in the solar terrestrial flux tube changes the rate that gases leave the solar surface via the flux tubes. The gas is mostly O+ ion that fluxes into the convective zone from broadcast induced cyclotron maser heating the of protons in the solar wind. This is especially the case with broadcasting frequencies on the gyro frequency. It is like the harmonic resonate vibration of one tuning fork to another, but these are strings of the fabric we live in, our environment. The O+ oxygen fuels the "fire" so to speak in the convective zone of the sun where the electrons are eager to balance the flow. Essentially the cyclotron maser boils the surface of the photosphere.
It could also be that the double peak in the solar cycle is related to the man made cyclotron induced ionization of the suns photosphere at a high enough rate to generate backscatter to form a kink. instability. There may also be a relation to the Maximum usable frequency and the attenuation of radio waves that vary by season. This seasonal variation effects the cyclotron maser waves traveling through the F layer of the ionosphere and is likely to follow the natural cycle closely, yet the difference is seen later in the double peak in sunspots with the first peak in delta sunspots (artificial) and the natural sunspot cycle following.


Polar Regions - Parts & Process
As we look into the polar regions we can see a complex system of electrical rivers and particle streams. There are four basic concepts that must be understood to follow the path of energy through the polar regions in relation to Broadcast Theory.
1.EIC waves cause electron precipitation which at relativistic energies generates X-ray 'bremsstrahlung' (breaking radiation) which interacts with stratospheric nitrogen creating NO/NO2 and OH that depletes ozone.
2.EIC waves cause ion outflows and a density shift in charged particles in polar regions while cyclotron maser frequency waves flow up magnetic field lines toward the sun heating solar protons contributing to kink in the flux tubes near the sun and a backscatter of ion flow in the solar convective region.
3.EICM waves slow ions in the solar wind and particle transport from the solar convective region, potentially contributing to delta type sunspots.
4.These sunspots in turn throw energy back at earth in the form of solar proton events that further deplete ozone.
5.Powerline Harmonic Radiation (PLHR) effects the magnetospheric generation of cyclotron maser plasma waves combine with increasing
electron density in the polar regions act as a secondary source of ionization in ozones fragile creation process.
1.EIC: Electrostatic Ion Cyclotron Waves - [E layer ~1.45MHz]
As EIC ionospheric plasma turbulence travels northward through the E layer toward the polar regions it undergoes amplification (magnetospheric dependant amplification), then in the cusp region where the magnetic field lines from the magnetosphere cross the ionosphere, it causes two populations of charged particles to flow out. One of them is a runaway population of electrons and ions from the ionosphere caused by the effects of the amplified cyclotron wave turbulence. The other is a population of relativistic electrons that precipitate from the magnetosphere.
Ionospheric EIC plasma wave intensifications crossing the magnetospheric flux tubes decrease the perpendicular force and change the pitch angle that magnetospheric particles rely on to stay trapped in the radiation belts allowing of particles to diffuse into the polar cusp at relativistic energies.
I will get into the effects of electron precipitation EEP-NOx and the different kinds in the next section on Ozone.
“Parallel to the well-known effects related to the seismic activity in the top side ionosphere such as small-scale irregularities generated due to acoustic waves (Hegai et.al.1997), and large-scale irregularities generated by anomalous electric field (Pulinets at al 2000), the modification of magnetic flux tube are also common features (Kim and Hegai 1997, Pulinets at al. 2002) So it seems that changes of the magnetic flux topology correlated with seismic activity can lead to the increase in the precipitation of energetic electron fluxes and, as a consequence, can yields excitation of the HF whistler mode. , H. Rothkaehl 2005”
(Page 27)
2. The EIC waves travel as an electron beam spiraling along the magnetic field line with O+ and H+ ions that flow to the polar regions where they cause charged particle outflows up along the open Interplanetary Magnetic Field (IMF) lines or the closed field lines of the radiation belt. The magnetic field lines come down upon the ionosphere as flux tubes in which the ions flow up and a charge exchange occurs causing electrons to precipitate down in what is called a Flux Transfer Event (FTE)
“One of the oldest known effects is electron heating in the F region which is caused largely by a thermal instability involving upper-hybrid plasma waves. Recently such electron heating has been shown to cause field-aligned ion outflows, which may help to further understand some of the naturally occurring outflows.” (Page 53)
“The outflow from the ionosphere is two orders of magnitude greater than predicted for the ‘‘classical’’ polar wind..” (Page 57)
Could it be that this extra ion upflow is coming from radio broadcast towers transmitting in the gyro-frequency range?
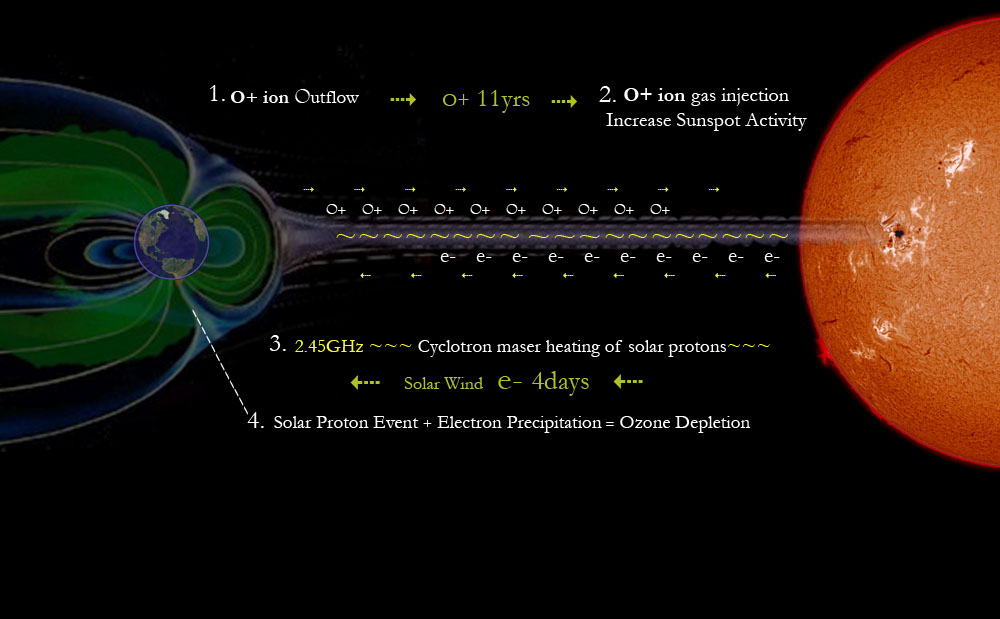
3.Cyclotron maser waves flow into the solar wind toward the sun. The maser waves change the speed of particles flowing Earthward through the solar wind flux tube. It takes approximately 9 - 11 years for this cyclotron maser induced particle density wave to reach the convective zone of the sun where gas injections have been observed. The convective zone of the sun is a place of powerful reactions and the electrons on the surface of the sun will eagerly leap forth to equalize and charge imbalance incurred by a gas injection. These are many facets to this process that will not be fully covered in this version of Broadcast Theory, but are explained in further detail in the larger version.
"The El Campo radar (see Figure 2.8), built by the Lincoln Laboratory, detected 38 MHz radar echoes from the Sun for a period of 9 years in the 1960's. Huge, rapidly-moving targets were occasionally observed but this was before the space-borne coronagraph discovery of coronal mass ejections (CMEs), and the physical nature of these “targets” was a mystery. It is now thought that CMEs were being observed.
Two examples of solar radar spectra observed by James in 1964.The data from 3 April are typical of 70 percent of El Campo spectra.The data from 29 April shows two scattering regions;the signal from the upper (more distant)region is likely caused by radar waves refracted to and from regions lying near the edge of the solar disk.At times James also observed echoes from regions lying up to 5 solar radii from the center of the sun (one solar radius equals 700 Mm)
Aside from the macroscopic physics of direct interest to the space weather program, there is great potential in unraveling the microscopic physics of the solar radar scattering mechanism.
An understanding of this mechanism is key to solving the puzzles of the spectral shape, the large Doppler spread, the Doppler shift, and the variation in solar radar cross section. Various mechanisms have been suggested, including turbulence in the local medium, fluctuations in the altitude of the plasma resonance level due to electron density fluctuations in the solar wind, ion acoustic waves, and coherent lower hybrid waves."
"However, in the case studied here, we find clear signatures of quasi-parallel sunward propagating ion-cyclotron waves. Concurrently, the solar wind proton velocity distribution reveals a sunward field-aligned beam that drifts at about the local Alfvén speed. This beam is found to run in the opposite direction of the normally observed (anti-sunward) proton beam, and is apparently associated with sunward propagating Alfvén/ion-cyclotron waves."
4.Sunspots throw energy back at earth in the form of solar proton events that can slash ozone levels 70%. These can be seen to not only follow the pattern of our historic use of broadcast frequencies, but cause a temperature variation that can be clearly seen in 1960. This was also known as Solar Cycle 19 and was the largest sunspot cycle on record and threw our ability to predict solar cycles out of alignment. Sunspots occur naturally according to the orbital paths of the planets around the sun and the crossing interplanetary magnetic field lines of two planets that are in alignment with the sun. There is a wealth of information on this topic as well as observations that will not be covered in this brief version of Broadcast Theory.
“The general trend in recent solar activity cycles (Figure 1) is toward larger amplitude sunspot cycles; Cycle 19 was the largest in recorded history (smoothed sunspot number maximum of 201 in March, 1958)”
“Hathaway has several graphs showing different prediction methods applied to past sunspot cycles. That is, they used the data from early in a cycle to "predict" what the rest of the cycle would do. Most predictions match reality fairly close, except for Cycle 19, the current record cycle, which peaked at 190 in sunspot number in 1957, just as the first space physics satellites were being launched.”
“Earth-directed solar explosions, for instance, tend to happen every 27 days -- the time it takes for sunspots to rotate once around the Sun. There is also an occasional 155-day cycle of solar flares. No one knows what causes it. And the double peaks of recent solar maxima are separated by approximately 18 months.
The source of all this variability is the turbulent Sun itself. The outermost third of our star -- the "convective zone" -- is boiling like hot water on a stove. California-sized bubbles rise 200,000 km from the base of the zone to the Sun's surface where they turn over and "pop," releasing heat (generated by nuclear reactions in the core) to space. Below the convective zone lies the "radiative zone" -- a calmer region where photons, not mass motions, transport the Sun's energy outward. Says Hathaway: "The Sun's magnetic field is generated at the boundary between these two layers where strong electric currents flow."
The first graph clearly shows that the two are correlated, but because the temperature flux comes before the solar flux, the sun cannot drive the temperature. This can only occur if the same mechanism that causes the temperature to rise also caused the solar variation resulting in solar cycle 19, the largest unpredicted cycle on record in 1960.
The 9 - 11 years between the two is the time is takes for the flux tube density irregularities to exchange between the sun and earth.
More of this is covered in the full version of Broadcast Theory.
5.Scientist have observed Powerline Harmonic Radiation (PLHR) on the magnetospheric generation of cyclotron maser plasma waves in combination with increasing electron density in the polar regions act as a secondary source of ionization in the ozone creation process. There is more on PLHR and this process in the full version of Broadcast Theory.
“Many observations of PLHR related emissions have been made. It seems that PLHR can control many more natural emissions than has usually been believed. Recently a cooperation was started with Dr. M. Parrot searching for PLHR-related events in the Freja satellite data which have been recorded simultaneously with our ground-based observations.”
“Parrot reviewed power line harmonic radiation; spectral lines spaced 50-60 Hz apart in the magnetosphere and generally observed to drift in frequency. The "Sunday effect" had been used confirm an anthropogenic source (no natural 7-day period). He speculated on an atmospheric/ionospheric link between PLHR and the greenhouse effect (in addition to the usually quoted increase in CO2 emissions associated with power generation), which could increase in importance as electrical power consumption continued to increase.”

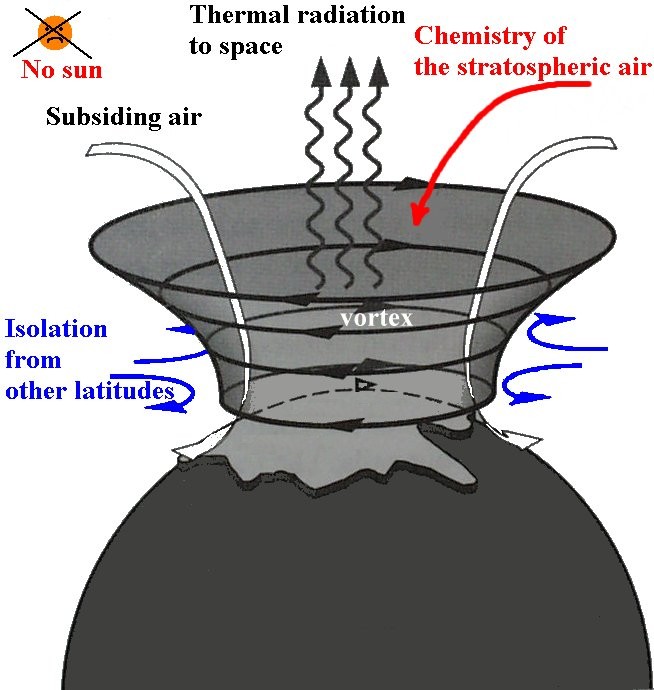
Polar Vortex
W E P - Whistler induced Electron Precipitation
Click & go
The electron-cyclotron maser instability as the source of solar type V continuum
Next click here
O - zone & Weather
Research Sections
Next click here
O - zone & Weather
Next click here
O - zone & Weather
Electrostatic Ion Cyclotron plasma waves flow toward the polar regions and drive electron precipitation and up open interplanetary magnetic field lines toward the sun
Next click here
O - zone & Weather
2. Cyclotron maser heating of solar protons in solar terrestrial flux tubes alter the speed of fast solar wind particles that lead to kinks in the flux tubes and energetic backscatter in the convective region of the sun.
1. Ionospheric ion outflows contribute to density shifts in polar ions and electrons while changing the charged currents of particles flowing through solar-terrestrial flux tubes as well as flux tube morphology.
Type Delta Sunspots
Solar Cycle 19: 1958 ~ 60
Temp
Sunspots
12hr ~ 4 days
Early Artificial Whistler Waves:
Observations and interest
in whistler-mode waves and wave-particle interactions began nearly 60 years ago.
Helliwell and Gehrels [1958] noted the first observations of man-made whistler-mode signals, and a referenced conference paper by Helliwell [1962] mentioned the first observations of VLF triggered emissions. Neither work could be located in their entirety, but are referenced and summarized in Helliwell and Katsufrakis [1974] and Helliwell et al. [1964] respectively
A number of observations were made using signals transmitted from VLF Navy transmitters [Helliwell et al., 1964; Lasch, 1969] as shown in Figure 1.8 and from Omega navigation transmitters [Kimura, 1968],
Whistlers are sometimes observed to be preceded by discrete rising tone emissions, so called whistler precursors. Park and Helliwell [1977] made a number of observations using Siple and Roberval of these whistler precursors to link them with power line radiation.
Sunward Propagating Alfven Waves in Association with Sunward Drifting Proton Beams in the Solar Wind:
Using measurements from the WIND spacecraft, here we report the observation of sunward propagating Alfvén waves (AWs) in solar wind that is magnetically disconnected from the Earth's bow shock. In the sunward magnetic field sector, we find a period lasting for more than three days in which there existed (during most time intervals) a negative correlation between the flow velocity and magnetic field fluctuations, thus indicating that the related AWs are mainly propagating sunward. Simultaneous observations of counter-streaming suprathermal electrons suggest that these sunward AWs may not simply be due to the deflection of an open magnetic field line. Moreover, no interplanetary coronal mass ejection appears to be associated with the counter-streaming suprathermal electrons. As the scale goes from the magnetohydrodynamic down to the ion kinetic regime, the wave vector of magnetic fluctuations usually becomes more orthogonal to the mean magnetic field direction, and the fluctuations become increasingly compressible, which are both features consistent with quasi-perpendicular kinetic AWs.
However, in the case studied here, we find clear signatures of quasi-parallel sunward propagating ion-cyclotron waves. Concurrently, the solar wind proton velocity distribution reveals a sunward field-aligned beam that drifts at about the local Alfvén speed. This beam is found to run in the opposite direction of the normally observed (anti-sunward) proton beam, and is apparently associated with sunward propagating Alfvén/ion-cyclotron waves. The results and conclusions of this study enrich our knowledge of solar wind turbulence and foster our understanding of proton heating and acceleration within a complex magnetic field geometry.
https://www.osti.gov/biblio/22522356-sunward-propagating-alfven-waves-association-sunward-drifting-proton-beams-solar-wind
Can energy flow toward the sun?
Before television and FM broadcast came over the airwaves the most powerful and consistent anthropogenic stimulation our ionosphere was subjected to was AM broadcast frequencies in the gyro frequency range and AM Apex stations which at the time had unfettered access to the E layer of the ionosphere and density ducts that channel Electrostatic Ion Cyclotron waves directly to the polar regions causing EEP-NOx
Sunward propagating Alfven/ion cyclotron waves have been observed in the solar wind along with heating and acceleration of sunward proton beams.
Once enough higher frequencies pierced the topside of the E layer to reflect off the F layer of the ionosphere, the E layer was no longer able to provide a direct channel for Electrostatic Ion Cyclotron waves to the polar regions suppressing the EEP-NOx ozone depletion process and likely any enhanced effects in the solar-terrestrial connection.
Ultra Short Wave - AM Apex
About the same time, experiments were begun using high fidelity AM transmissions at what was then considered the upper limits of practical radio technology. Those frequencies, between 25 and 42 MHz, were called “Ultra Short Wave.”
These radio stations were called “Apex” stations because of their high frequencies and high antenna locations.
They could operate up to 1,000 watts on several groups of frequencies at 25-26 MHz and 42 MHz
By 1939, there were Apex station stations operating in 34 cities in 22 states.
As today’s ten meter ham radio operators know very well, propagation conditions on the frequencies that were used by the Apex stations vary tremendously over the eleven year sunspot cycle.
The sun was just coming out of a sunspot minimum when the first Apex experiments began in 1932, so the new stations probably experienced mostly interference-free coverage during their first few years of operation. But sunspots were at their peak in 1936, and suddenly the experimental Apex stations were being heard all around the globe.
http://www.theradiohistorian.org/Apex/Apex1.htm
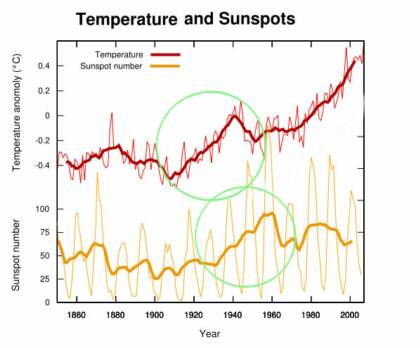
9-11 year difference in temperature vs sunspot trend leading up to Solar Cycle 19
Roles of whistler mode waves and magnetosonic waves in changing the outer radiation belt and the slot region
Using the Van Allen Probe long‐term (2013–2015) observations and quasi‐linear simulations of wave‐particle interactions, we examine the combined or competing effects of whistler mode waves (chorus or hiss) and magnetosonic (MS) waves on energetic (<0.5 MeV) and relativistic (>0.5 MeV) electrons inside and outside the plasmasphere.
Although whistler mode chorus waves and MS waves can singly or jointly accelerate electrons from the hundreds of keV energy to the MeV energy in the low‐density trough, most of the relativistic electron enhancement events are best correlated with the chorus wave emissions outside the plasmapause.
Inside the plasmasphere, intense plasmaspheric hiss can cause the net loss of relativistic electrons via persistent pitch angle scattering, regardless of whether MS waves were present or not. The intense hiss waves not only create the energy‐dependent electron slot region but also remove a lot of the outer radiation belt electrons when the expanding dayside plasmasphere frequently covers the outer zone.
Since whistler mode waves (chorus or hiss) can resonate with more electrons than MS waves, they play dominant roles in changing the outer radiation belt and the slot region. However, MS waves can accelerate the energetic electrons below 400 keV and weaken their loss inside the plasmapause. Thus, MS waves and plasmaspheric hiss generate different competing effects on energetic and relativistic electrons in the high‐density plasmasphere..
https://agupubs.onlinelibrary.wiley.com/doi/abs/10.1002/2016JA023634
https://eos.org/research-spotlights/how-whistling-plasma-waves-shape-earths-radiation-belts
Additional Notes:
https://www.nap.edu/read/13060/chapter/12
Ionospheric ~ Magnetospheric Coupling
file:///Users/Reception/Downloads/inos_ch6.pdf
A wave‐wave interaction in whistler frequency range in space plasma
The quantitative theory is developed for the frequency spectrum broadening and sideband structure of VLF signals in the upper ionosphere. The theory is based on a common theory of wave‐wave interaction in plasma and includes the transformation effects of a quasi‐monochromatic whistler wave into quasi‐electrostatic whistler mode waves (l waves) near the resonance cone with their interaction with field‐aligned plasma density (electric field) inhomogeneities. Such inhomogeneities can be ion‐acoustic or ion cyclotron electrostatic waves. We consider both cases of regular (deterministic plases) and irregular (random phases) inhomogeneities. The spectral characteristics and interaction length of l waves and some nonstationary effects are considered, which permit us to obtain the quantitative interpretation of main experimental data. The conditions of high coherence of interacting waves are investigated, which are compared with the results of bicoherence analysis of sideband structure of VLF signals. The estimations of bicoherence value are given for such type of wave‐wave interaction.
https://agupubs.onlinelibrary.wiley.com/doi/pdf/10.1029/93JA01640
Quasielectrostatic and electrostatic approximations for whistler mode waves in the magnetospheric plasma
Three model electron distribution functions representative of the region between the plasmapause and the geostationary orbit are constructed. These models are used to compare numerical solutions of the hot electromagnetic dispersion equation with analytical solutions of the quasielectrostatic dispersion equation, and to compare numerical and analytical solutions of the electrostatic dispersion equation, for whistler mode propagation at wave normal angles θ close to the resonance cone angle θR. It is shown that the quasielectrostatic solutions are a reasonable approximation for all three models when θ < θR, but when θ > θR the approximation only remains good inside the plasmapause for frequencies ω equal to 0.4 times the electron gyrofrequency Ω. For θ > θR the agreement between numerical electromagnetic and electrostatic solutions is good when . Numerical results show that for the solutions to the quasielectrostatic equation for large refractive index correspond to strongly damped waves for each model.
https://www.sciencedirect.com/science/article/pii/0032063390900958?via%3Dihub
On the problem of quasi-electrostatic whistler mode waves: A possible interpretation of discrete plasmaspheric emissions - 1988
In a number of VLF experiments with low-orbiting Intercosmos satellites, high-intensity, discrete VLF emissions at frequencies above the local LHR were observed predominantly between L=2.3 and 4.0. The frequency of their intensity maximum varies continuously with geomagnetic latitude, and approximately parallels the value of a quarter of the equatorial electron gyrofrequency. An attempt is made to interprete these emissions in terms of quasi-electrostatic whistler-mode waves, generated in the near-equatorial region and propagating downward in the quasi-resonance mode. The generating mechanism is supposed to be the kinetic instability connected with the loss-cone and temperature anisotropy of the distribution function of energetic electrons. Some features of the discrete plasmaspheric emissions are discussed on the basis of theoretical considerations.
https://link.springer.com/article/10.1007%2FBF01637582
Spatial Distribution of Fine‐Structured and Unstructured EMIC Waves Observed by the Arase Satellite - June 2018
The spatial distribution of electromagnetic ion cyclotron (EMIC) waves is important and fundamental information from the point of view of wave‐particle interaction process. Several studies have determined the distributions of EMIC waves. However, they have been controversial, because there are several possible mechanisms for generating EMIC waves. We discriminated 378 events observed by Arase into two types, according to whether or not they exhibited clear periodic amplitude modulations. We found a clear afternoon peak in the occurrence probability of unstructured EMIC waves in the region of L = 5–9. This is consistent with previous observations. Fine‐structured EMIC waves were mainly distributed in the off‐equatorial region, and their occurrence probability was clearly high around noon. Such noon peaks had not been found in the THEMIS, AMPTE, or Cluster measurements, due to their limited L shell coverages. The Van Allen probes measured the region of L = 2–6, but they also did not report such a noon sector peak. Our statistical results suggest that the Van Allen probes, too, were not able to measure the major region of fine‐structured EMIC waves because of their limited latitudinal coverage. Our unique statistical results demonstrate the importance of discriminating the wave structures as well as of performing observations over a wide range of latitudes.
http://www.atrasc.com/content/stick/papers/SH0204.pdf
The Ares satellite launched in 2016 was able to image more of the magnetosphere and observed a peak in dayside EMIC wave generation.
Also that EMIC waves appear structured.. I suspect through ionospheric waveguide ducting. So far EMIC waves are the leading culprit in relativistic electron precipitation. It's likely they are enhanced by gyrofrequency stimulation by AM Broadcast near high power VLF transmitters.
Confirmation of EMIC wave-driven relativistic electron precipitation - 2016
Electromagnetic ion cyclotron (EMIC) waves are believed to be an important source of
pitch angle scattering driven relativistic electron loss from the radiation belts. To date, investigations
of this precipitation have been largely theoretical in nature, limited to calculations of precipitation
characteristics based on wave observations and small-scale studies. Large-scale investigation of EMIC
wave-driven electron precipitation has been hindered by a lack of combined wave and precipitation
measurements. Analysis of electron flux data from the POES (Polar Orbiting Environmental Satellites)
spacecraft has been suggested as a means of investigating EMIC wave-driven electron precipitation
characteristics, using a precipitation signature particular to EMIC waves. Until now the lack of supporting
wave measurements for these POES-detected precipitation events has resulted in uncertainty regarding
the driver of the precipitation. In this paper we complete a statistical study comparing POES precipitation
measurements with wave data from several ground-based search coil magnetometers; we further present
a case study examining the global nature of this precipitation. We show that a significant proportion of
the precipitation events correspond with EMIC wave detections on the ground; for precipitation events
that occur directly over the magnetometers, this detection rate can be as high as 90%. Our results
demonstrate that the precipitation region is often stationary in magnetic local time, narrow in L,
and close to the expected plasmapause position. Predominantly, the precipitation is associated with
helium band rising tone Pc1 waves on the ground. The success of this study proves the viability of POES
precipitation data for investigating EMIC wave-driven electron precipitation.http://nora.nerc.ac.uk/id/eprint/513194/1/Hendry_et_al-2016-Journal_of_Geophysical_Research__Space_Physics.pdf
Radiation Belt Electron Loss Mechanisms: New results
The radiation belt electron precipitation (RBEP) into the topside ionosphere is a phenomenon which is known for several decades. However, the radiation belt source and loss mechanisms have not still well understood, including PBEP. Here we present the results of a systematic study of RBEP observations, as obtained from the satellite DEMETER and the series of POES satellites, in comparison with variation of seismic activity. We found that this type of RBEP bursts present special characteristics in the inner region of the inner radiation belt before large (M>7, or even M>5) earthquakes (EQs), as for instance characteristic (a) flux-time profiles, (b) energy spectrum, (c) electron flux temporal evolution, (d) spatial distributions and (e) they are associated with broad band VLF activity, some days before an EQ. The RBEP before EQs appears, not only as a burst, but as an increase of the normal electron background flux in large range of latitudes during magnetospheric storms. Recent results, in the presence of a magnetospheric storm and of strong seismic activity, seem to suggest an increase of the normal flux in the slot region as well. We found significant evidence that, among EQs-lightings-Earth based transmitters, seismic activity is that agent which probably make the main contribution to the RBEP at middle latitudes. Further research is in progress in order to further test the present results.
https://www.researchgate.net/publication/329987675_Radiation_Belt_Electron_Loss_Mechanisms_New_results
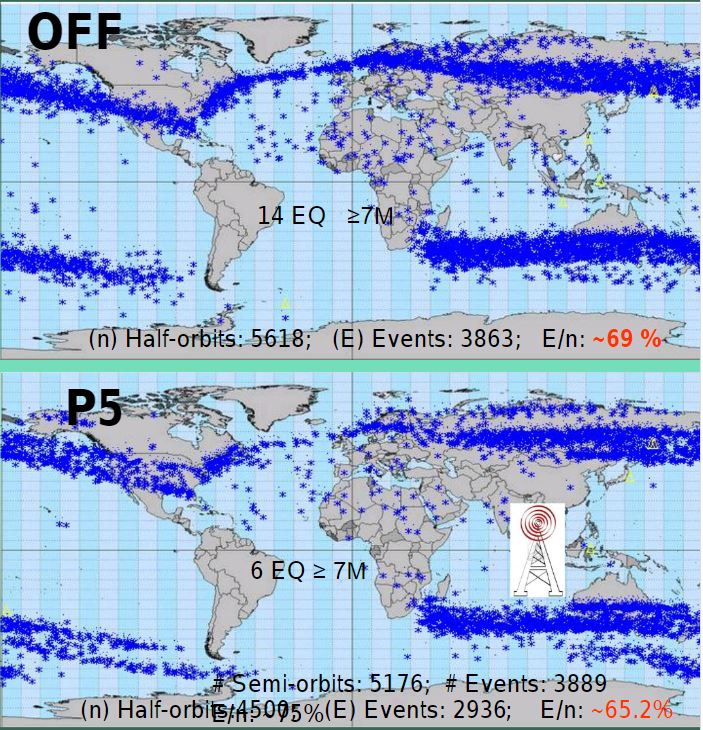
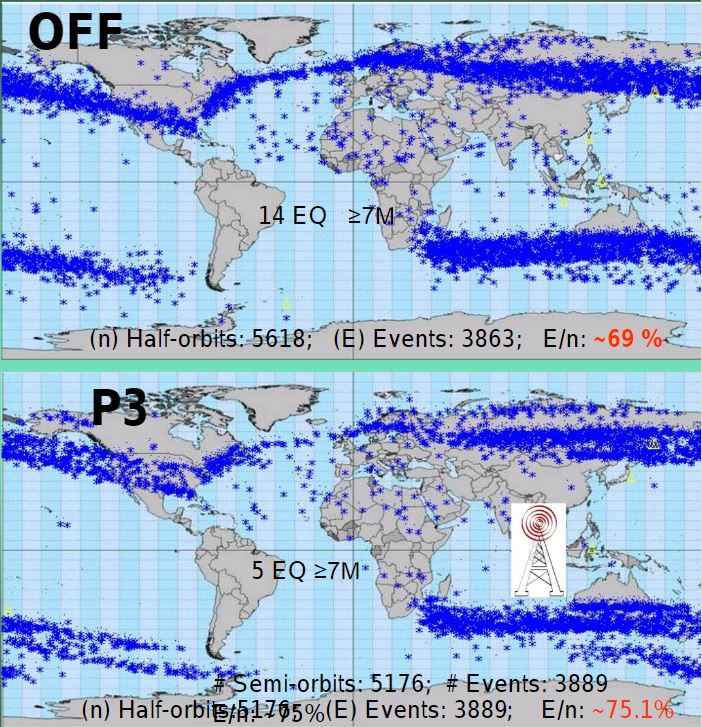
If there are less REP events when the transmitter is on this might suggest that the VLF transmitter is suppressing REP.
Though we need more data because there isn't enough transmitter OFF data to compare. Data set too small.
Observations and Modeling of Increased Nitric Oxide in the Antarctic Polar Middle Atmosphere Associated With Geomagnetic Storm‐Driven Energetic Electron Precipitation
Nitric oxide (NO) produced in the polar middle and upper atmosphere by energetic particle precipitation depletes ozone in the mesosphere and, following vertical transport in the winter polar vortex, in the stratosphere. Medium‐energy electron (MEE) ionization by 30–1,000 keV electrons during geomagnetic storms may have a significant role in mesospheric NO production. However, questions remain about the relative importance of direct NO production by MEE at altitudes ~60–90 km versus indirect NO originating from auroral ionization above 90 km. We investigate potential drivers of NO variability in the southern‐hemisphere mesosphere and lower thermosphere during 2013–2014. Contrasting geomagnetic activity occurred during the two austral winters, with more numerous moderate storms in the 2013 winter. Ground‐based millimeter‐wave observations of NO from Halley, Antarctica, are compared with measurements by the Solar Occultation For Ice Experiment (SOFIE) spaceborne spectrometer. NO partial columns over the altitude range 65–140 km from the two observational data sets show large day‐to‐day variability and significant disagreement, with Halley values on average 49% higher than the corresponding SOFIE data. SOFIE NO number densities, zonally averaged over geomagnetic latitudes −59° to −65°, are up to 3 × 10⁸/cm3 higher in the winter of 2013 compared to 2014. Comparisons with a new version of the Whole Atmosphere Community Climate Model, which includes detailed D‐region ion chemistry (WACCM‐SIC) and MEE ionization rates, show that the model underestimates NO in the winter lower mesosphere whereas thermospheric abundances are too high. This indicates the need to further improve and verify WACCM‐SIC with respect to MEE ionization, thermospheric NO chemistry, and vertical transport.
https://agupubs.onlinelibrary.wiley.com/doi/full/10.1029/2018JA025507
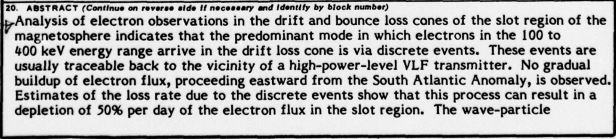
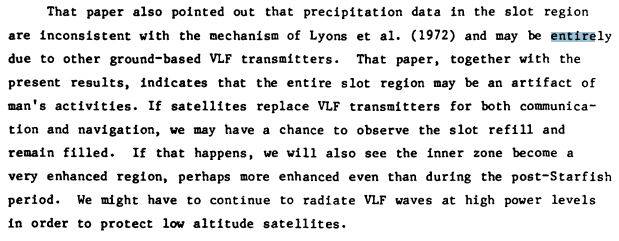
VLF Transmitter Induced Slot Electron Precipitation - 1977
https://apps.dtic.mil/dtic/tr/fulltext/u2/a049086.pdf
The COMPASS2 satellite and the ground-based LOIS vector sensing radar facility as novel tools for ionospheric plasma diagnostics
The possibility that the ionosphere can be modified by powerful radio waves was first noted by Ginzburg and Gurevich (1960) (Gurevich, 1998 ). The earliest space observations of ionospheric modification due to human activity were observed by the VLF wave measurements on board the Ariel-3 and Ariel-4 satellites, which showed an increased electron precipitation during high-power VLF transmissons from the ground (Vampola et al., 1977; Bollough et al., 1985). The review article by Parrot and Zaslavski (1996) describes a large variety of observed phenomena related to human activities, such as wave–particle interactions, precipitation of radiation-belt electrons, parametric coupling of whistler waves, triggering emissions, wave frequency shifts, and spectrum broadening.
https://www.sciencedirect.com/science/article/pii/S1364682607002088?via%3Dihub
The El Campo radar (see Figure 2.8), built by the Lincoln Laboratory, detected 38 MHz radar echoes from the Sun for a period of 9 years in the 1960's. Huge, rapidly-moving targets were occasionally observed but this was before the space-borne coronagraph discovery of coronal mass ejections (CMEs), and the physical nature of these “targets” was a mystery. It is now thought that CMEs were being observed.
Two examples of solar radar spectra observed by James in 1964.The data from 3 April are typical of 70 percent of El Campo spectra.The data from 29 April shows two scattering regions;the signal from the upper (more distant)region is likely caused by radar waves refracted to and from regions lying near the edge of the solar disk.At times James also observed echoes from regions lying up to 5 solar radii from the center of the sun (one solar radius equals 700 Mm)
Aside from the macroscopic physics of direct interest to the space weather program, there is great potential in unraveling the microscopic physics of the solar radar scattering mechanism.
An understanding of this mechanism is key to solving the puzzles of the spectral shape, the large Doppler spread, the Doppler shift, and the variation in solar radar cross section. Various mechanisms have been suggested, including turbulence in the local medium, fluctuations in the altitude of the plasma resonance level due to electron density fluctuations in the solar wind, ion acoustic waves, and coherent lower hybrid waves.
The possibility of coherent coronal plasma waves is especially intriguing as it is a topic of current interest, and a search for such waves was included in the observing program for the Solar and Heliospheric Observatory (SOHO) spacecraft. - http://www.mso.anu.edu.au/~fbriggs/LOFAR_SciApp_1.0.pdf
When we look at the sunspot cycle we see the last few decades as an anomaly beginning near 1940:
"Clearly, the level of activity has remained variable, with episodes of particularly low numbers of sunspots (grand minima) distributed over the whole record. Episodes of high activity are also present. These are mostly concentrated in the earliest three millennia (before 6000 BC), which also exhibit a high average sunspot number (35.6 compared to 25.6 after 6000 BC). During the last eight millennia, the episode with the highest average sunspot number is the ongoing one that started about 60 years ago. The sunspot number averaged over the whole period is 28.7 with a standard deviation of 16.2. The average number of 75 since 1940 thus lies 2.85 standard deviations above this longterm average."
http://cc.oulu.fi/~usoskin/personal/nature02995.pdf
Several studies have shown that ducted and nonducted VLF waves can precipitate radiation belt energetic electrons into the upper atmosphere. Here we investigate the propagation of VLF communication transmitter signals using plasma wave instruments on board the CRRES and DEMETER satellites in order to determine if non-ducted transmitter signals are significant in radiation belt loss processes. We investigate the regions where strong transmitter signals are observed in the ionosphere directly above the transmitter, in the magnetosphere near where the signals cross the geomagnetic equator, and in the ionospheric region geomagnetically conjugate to the transmitter.
https://www.academia.edu/34759438/Ground-based_transmitter_signals_observed_from_space_Ducted_or_nonducted
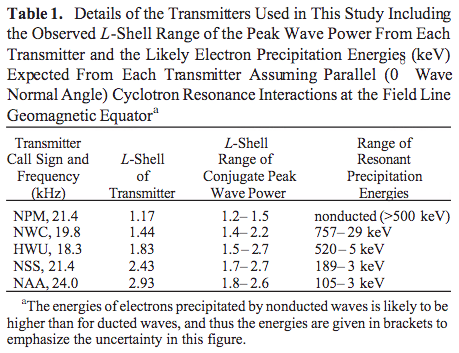
NWC transmitter; the energy of the precipitation electrons is between 100 keV and 361.57 keV, among which the precipitation of 213.73 keV electrons is most conspicuous.
http://www.eppcgs.org/en/article/doi/10.26464/epp2018052
The energy range of the NWC precipitation belt is 100–361.57 keV; the electron precipitation is most conspicuous at energy 213.73 keV. In the inner Van Allen radiation belt, besides the precipitation of large amount of low‐energy (100–300 keV) electrons, the electron number in the energy range 300–623.14 keV is also relatively large.
in the NWC electron precipitation belt the number of electrons of energy 213.73 keV is the largest; there are three other electron flux maxima respectively at 111.37 keV, 270.58 keV, and 668.63 keV; (4) according to the ratios to the background value (red curve in the second subfigure of Figure 10), in the NWC electron precipitation belt the electron fluxes in the range 100–361.57 keV are enhanced by about several orders of magnitude—especially near the energy 213.73 keV the enhancement of electron flux is most prominent; (5) compared to the NWC electron precipitation belt, electron fluxes in the energy range 300–623.14 keV are obviously enhanced in the radiation belt (blue curve in the second subfigure ofFigure 10), indicating that more electrons of higher energy precipitate with increasing L.
https://agupubs.onlinelibrary.wiley.com/doi/10.26464/epp2018052