Effects on the Weather
Because there was so much water vapor in the air when television came over the airwaves in 1946/47 broadcasting above the 2nd gyroharmonic calming the electron precipitation (NO2 production and ozone depletion) the temperature dropped as quickly as the ozone layer could repair itself. With all the moisture in the air it began to rain and snow! Below are reports matching this event.
Warning - If we turn down AM broadcast near gyro frequency...do it gradually!
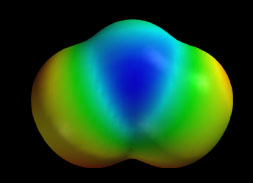
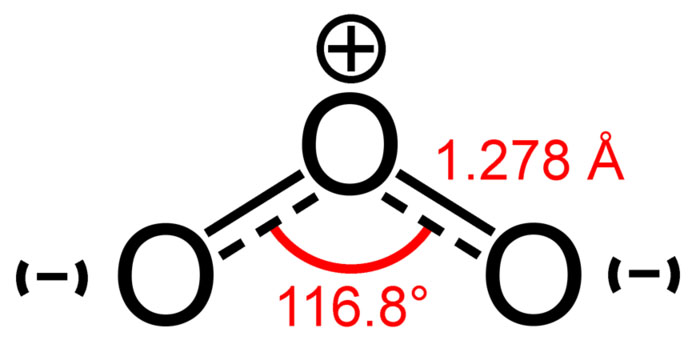
O - zone is a fragile molecule and is easily bullied around by other chemical reactions. It is an allotrope of oxygen that is much less stable than the diatomic species O2 and is the second most powerful oxidizing agent and is unstable in high concentrations decaying to ordinary diatomic oxygen. Being an allotrope it has the ability to catenate and form covalent bonds with it self which makes it very sensitive to it’s electro-negativity.
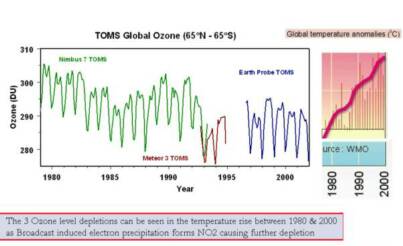
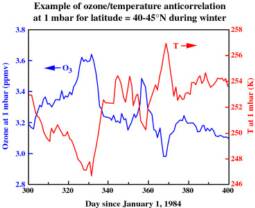
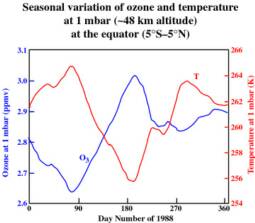
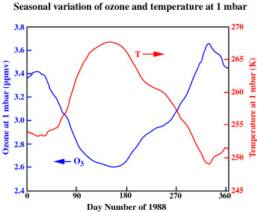
The connection between temperature and ozone levels is evident in these text book examples below.
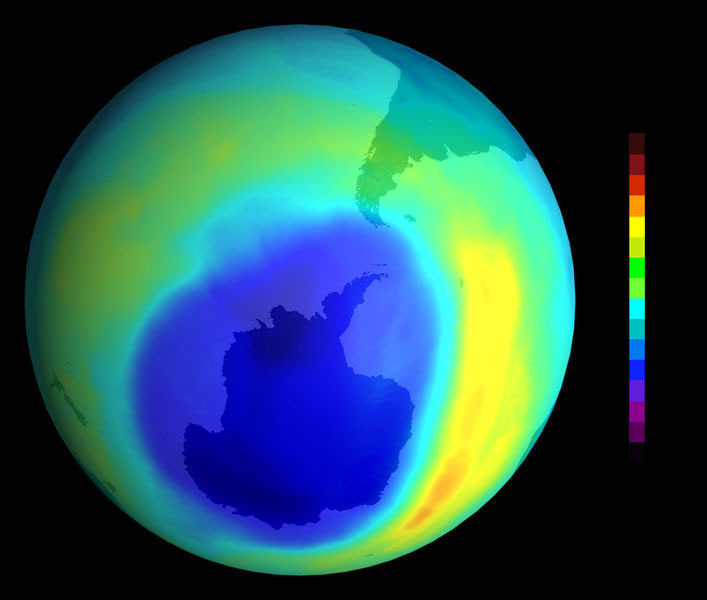
Ozone depletion describes two distinct, but related observations: a slow, steady decline of about 4 percent per decade in the total amount of ozone in Earth's stratosphere since around 1980; and a much larger, but seasonal, decrease in stratospheric ozone over Earth's polar regions during the same period. The latter phenomenon is commonly referred to as the ozone hole which are formed due to particle precipitation from CFC's, solar proton events and electron precipitation that funnels into the polar vortex.
Electron funnel
"The domino-like effect began in October and November 2003, when the Sun unleashed a record barrage of radiation and charged particles toward Earth. The planet's magnetic field funneled some of the storm's electrons into the upper atmosphere above the poles. The electrons hit nitrogen molecules there, breaking some of them into nitrogen ions. Those reactive atoms then combined with nearby oxygen molecules to form molecules of (NO) nitrogen oxide - levels of which rose in November and December 2003, according to the satellite data.
Finally, downward-blowing winds in a polar vortex above the Arctic pushed these molecules into the stratosphere. There, each nitrogen oxide molecule could rip apart hundreds of ozone molecules, just as CFCs do. The effect remained even into July 2004, according to Randall's observations.”
http://www.newscientist.com/article.ns?id=dn7088 Click & go
Electron precipitation from broadcast radio occurs in the same manner and although this is a dramatic example of this kind of ozone depletion it was found that ozone depletion over all hadn’t crept up over night. In fact NASA was criticized for not recognizing it earlier because the ozone layer had been diminishing slowly and gradually for quite a while with estimates going back at least till1976. How about since 1909? When radio broadcast first came over the airwaves?
One of them is the runaway population of electrons and ions from the ionosphere caused by the effects of the powerful HF radio wave. The other is the population of electrons that precipitate from the magnetosphere. It is shown that the hydrodynamical equilibrium was disrupted due to the effects of the HF pumping."
Hydrodynamical equilibrium is a factor in stratospheric ozone Click & go
Through the experiments at HAARP researchers found that pumping radio waves into the atmosphere changed the hydrodynamical equilibrium through electron precipitation. Because ozone is such a fragile molecule and relies on covalent bonds any disruption to the local electronegativity will alter the chemical reactions.

O ~ Zone & Greenhouse Effect
Sea Level and the Southern Oscillation
The lowest point of sea level was about 1890; the mean rise from 1900-1950 was 1-2 mm annually, but the fastest decade was 1946-1956 with 55mm. Click for Source

The Winter of 1946/47
Bringing about the start of the third cold spell was an anticyclone that became anchored over Scandinavia around 20 January. This blocked the eastward progress of Atlantic depressions and forced them to take routes south of the UK. The result was that easterly winds set in, bringing snow first to eastern and south-east England before extending across much of the country.
Coldest February on record
Easterly winds persisted throughout February, with only brief breaks in the cold snowy weather. On no day did the temperature at Kew Observatory top 5 °C, and only twice in the month was the night minimum temperature above freezing. It was the coldest February on record in many places and, for its combination of low temperatures with heavy snow, bore comparison with January 1814.
On no day in February 1947 did the temperature at Kew Observatory top 4.4 °C, and only twice in the month was the night minimum temperature above 0 °C
The mean maximum temperature for the month was 0.5 °C (6.9 °C below average) and the mean minimum was -2.7 °C (4.6 °C below average)
On 26 of the month's 28 days, snow was lying at 0900 UTC
South of a line from The Wash to the River Dee, mean maximum temperatures were everywhere more than 5.5 °C below average and, in some places, more than 7 °C below average
Mean minimum temperatures were more than 4 °C below average everywhere in the south and south-west of England, and almost 6 °C below average in some places
Click for Source

Tropospheric propagated signals travel in the part of the atmosphere adjacent to the surface and extending to some 25,000 feet (7,620 meters). Such signals are thus directly affected by weather conditions extending over some hundreds of miles. During very settled, warm anticyclonic weather (i.e., high pressure), usually weak, snowy TV signals from distant transmitters improve in signal strength.
A settled high-pressure system gives the classic conditions for enhanced tropospheric propagation, in particular favoring signals which travel along the prevailing isobar pattern rather than across it. Such weather conditions can occur at any time, but generally the summer and autumn months are the best periods. In certain favorable locations, enhanced tropospheric propagation may enable reception of UHF TV signals up to 1,000 miles (1,600 km) or more.
Two months later as winter came the weather shifted dramatically!
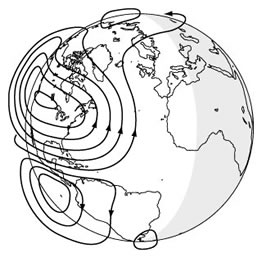
The temperature dropped and freak snow storms ravaged parts of the United States and Europe. This was one of the strangest storms in history and it began with an anticyclone that centered in central Scandinavia. If you look at the ionospheric diurnal flows you can see not only how the anticyclone might have resulted from the shift in it’s gyrofrequency, but you can see the path with which our broadcast frequencies could effect the weather as it travels from the lower latitude United States up toward the higher latitudes across the Atlantic ocean effecting Europe and Scandinavia.
Cold, dry and cloudy
At Kew, Nottingham and Edgbaston, there was no sun on 22 days and, at Kew, there was none at all from the 2nd to the 22nd. Most places in the Midlands and southern England recorded sunshine totals less than half the average. When skies did clear, night-time temperatures plunged. A minimum of -21 °C was recorded at Woburn in Bedfordshire early on the 25th. Without the cloud, the month would almost certainly have been even colder than it was, certainly at night.
Gales and snow in March
If February hadn't been enough, March proved to be even worse. In the first half of the month, there were more gales and heavy snowstorms. On 4 and 5 March, heavy snow fell over most of England and Wales, with severe drifting. On 6 March, drifts were five meters deep in the Pennines and three meters in the Chilterns. In some places, glazed frost occurred. On 10 and 11 March, southern Scotland had its heaviest snowfall of the winter and, on the 12th the Scottish Highlands reported drifts more than seven metres deep.
Thaw brings floods
Meanwhile, mild air with a temperature of 7-10 °C edged into the extreme south-west of the UK on 10 March, bringing rain. The ensuing thaw was rapid - by the evening of the 11th, vast areas of southern England were under water. After weeks of frost, the ground was frozen hard. The rain and meltwater couldn't soak into the ground - surface run-off was its only option.
The warm air spread northwards and eastwards. Meltwater from the Welsh mountains poured into the valleys of the Severn and Wye, flooding Herefordshire and Gloucestershire. The rivers of the English Midlands burst their banks and, by 13 March, Fenland rivers were close to overspill.
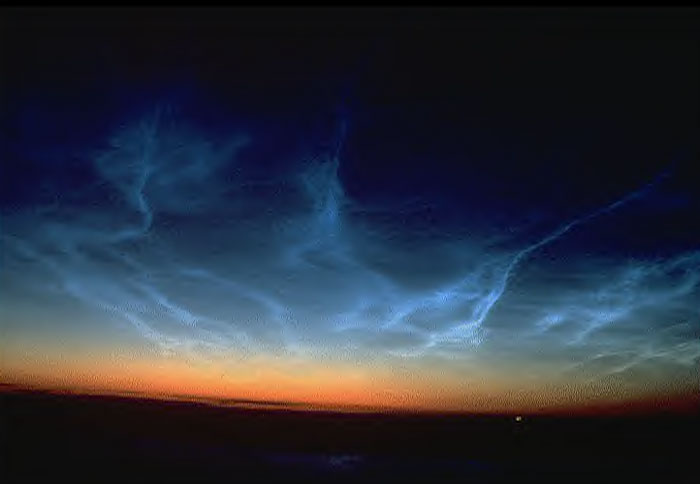
EFFECT OF RADIOWAVE HEATING ON POLAR MESOSPHERIC CLOUDS
Polar Mesospheric Clouds (PMC) are composed of dust grains (aerosols) of submicron size at altitudes within 80–90 km. The grains, formed presumably by iced particles nucleated around small meteor dust, acquire electric charges and may change significantly the properties of the ambient ionospheric plasma. The charged dust is believed to be the major cause of the Polar Mesosphere Summer Echoes (PMSE).The charge of dust particles is formed by attachment of the free electrons and ions and by photo emission. The dust charge depends on the grain sizes, plasma parameters and the dust material. Recently discovered effect of the radio wave electron heating on PMSE opens new opportunities in PMC studies. We present a dynamical model of local dust charging. Rapid local heating of electrons by the high-power radio wave results in parameter-sensitive modifications of the average dust charge and free-electron density. By monitoring the dynamics of free electron density during variable radio wave heating, parameters of dusty plasma, such parameters as mean particle size, dust density properties of material, rates of photo detachment and photo ionization/detachment can be deduced. Click for Source
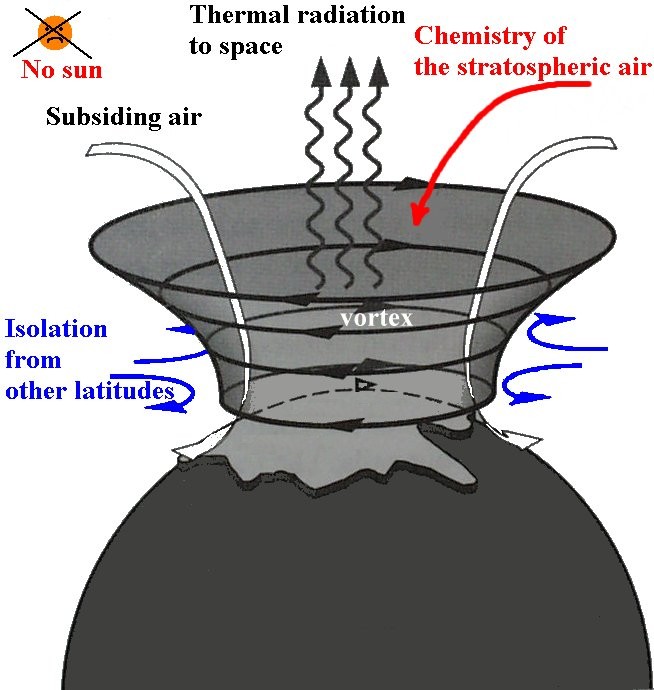
Polar Vortex
Water vapor in the atmosphere absorbs the solar radiation and causes the temperature to rise. In 1946/47 there was an abundant amount of water vapor into the air and after television came on this calmed electron precipitation and when the ozone layer began to repair itself all the water vapor in the air condensed as the temperature dropped and the weather was greatly affected.
O – zone - Parts & Process
1. Electron precipitation creates NO2 and OH which deplete the stratospheric ozone.
2.Electron precipitation disrupt the hydrodynamic equilibrium and increases the electron density which lowers the atmospheric electronegativity, both of which the ozone relies on in its creation process.
3.The effects of ozone depletion increases incoming solar radiation and causes evaporation of ocean water into vapor that acts as the most abundant source of heat in the greenhouse effect.
4.Broadcast television clamps the ion acoustic turbulence resulting in the reduction in the greenhouse effect. This can be seen in the global temperature graph as well as weather reports and ocean oscillation cycles.
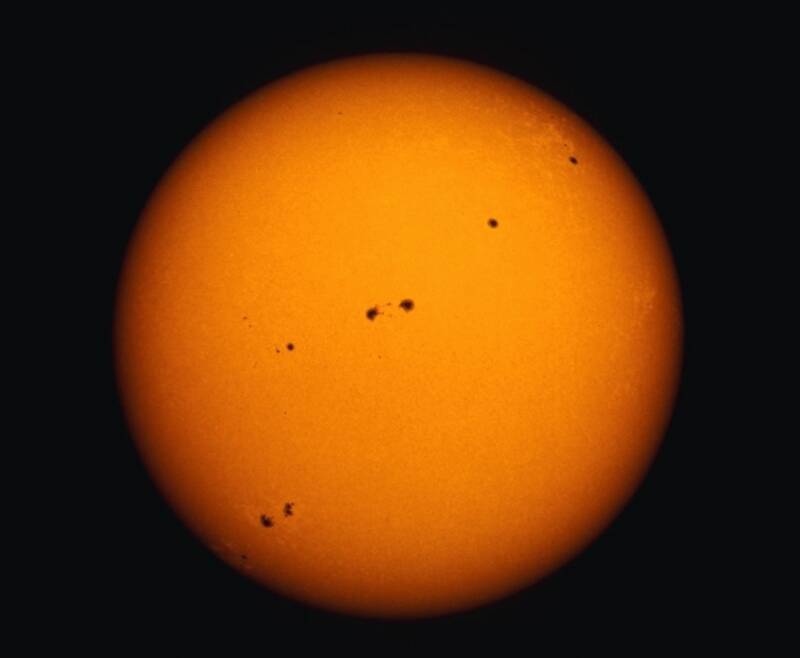
1. The ozone layer is our most important defense against the suns powerful radiation that heats the planet. It is a fragile molecule and is easily bullied around by other chemical reactions and electrical fluctuations in the atmosphere. The highest levels of ozone in the atmosphere are in the stratosphere, in a region also known as the ozone layer between about 10 km and 50 km above earths surface. It is created by the suns UV radiation and destroyed by the reaction with atomic oxygen:
O3 + O → 2 O2
Power Line Harmonic Radiation (PLHR) as well as broadcast radiation from the radio, television, and telecom industry interact with the magnetosphere and ionosphere which cause these particles to rain down. The planet's magnetic field funnels the electrons into the upper atmosphere above the poles. The electrons hit nitrogen molecules there, breaking some of them into nitrogen ions. Those reactive atoms then combined with nearby oxygen molecules to form molecules of (NO) nitrogen. Finally, downward-blowing winds in a polar vortex above the Arctic pushed these molecules of NO2 and OH into the stratosphere. There, each nitrogen oxide and hydroxyl molecule could rip apart hundreds of ozone molecules, just as CFCs do.
“During geomagnetically disturbed periods the precipitational loss of energetic electrons from the outer radiation belt of the earth can readily provide the major ionization source for the mesosphere and upper stratosphere. One particularly intense manifestation of this interaction between the radiation belts and the lower atmosphere is the relativistic electron precipitation (REP) event which occurs at subauroral latitudes during magnetospheric substorm activity. At relativistic energies the precipitating electrons produce copious fluxes of energetic bremsstrahlung X-rays, the major portion of which penetrate deep into the stratosphere before undergoing excitation and ionization collisions with the neutral atmosphere. If such REP events occur more than a few per cent of the time, they can, on an annual basis, provide a local source of upper stratospheric nitric oxide molecules (via the dissociation of molecular nitrogen) comparable to that from either galactic cosmic rays or energetic solar proton events.” (Page 72)
2.Although the polar regions are generally considered the most tenuous regions of the atmosphere the electron precipitation increases the electron density and peaks and the polar cap which disrupts the hydro dynamic equilibrium and lowers the atmospheric electro-negativity both of which ozone relies on in it’s creation as it takes a certain amount of activation energy for the chemical reactions to function properly.
“Experimental results from three ionospheric HF pumping experiments in overdense E or F regions are summarized…The authors present their interpretation of the data as follows. It is suggested that two populations of charged particles are at play. One of them is the runaway population of electrons and ions from the ionosphere caused by the effects of the powerful HF radio wave. The other is the population of electrons that precipitate from the magnetosphere. It is shown that the hydrodynamical equilibrium was disrupted due to the effects of the HF pumping.” (Page 54)
“SF_6 content and power dependences of plasma parameters such as the electronegativity, the electron density and the effective electron temperature were investigated in a RF Xe/SF_6 inductively coupled plasma (ICP), with keeping the total pressure for discharge-off at 2.5 mTorr… The electronegativity does not strongly depend on SF_6 content, while it decreases gradually with the increase of electron density. This work was partially supported by Grant-in-Aid from Japan Society for the Promotion of Science.”
3.Ozone depletion describes two distinct, but related observations: a slow, steady decline of about 4 percent per decade in the total amount of ozone in Earth's stratosphere since around 1980; and a much larger, but seasonal, decrease in stratospheric ozone over Earth's polar regions during the same period. The latter phenomenon is commonly referred to as the ozone hole.
As the ozone layer becomes thinner it blocks less and less of the solar radiation allowing the solar energy to heat the ocean water causing it to evaporate into the atmosphere. The increase in water vapor then acts as a greenhouse gas. Water vapor is the most powerful greenhouse gas and is the most abundant of all the greenhouse gasses in the air.
4.As the temperature slowly crept up it wasn’t until 1946 that the rise in temperature took its first dip. In 1946/47 the largest shift in frequency ERP occurred in the northern hemisphere. The FCC reallocated long-wave FM broadcast to higher frequencies upon the recommendation of FCC engineer Kenneth Norton, who, combined WWII skywave propagation results from the War Department, data from the Bureau of Standards and measurements from FM radio station WGTR in Paxton. He determined that propagation in the LW FM band would cause a great deal of interference due to it’s interaction with the E and F layers of the ionosphere. During this time a television broadcast boom came over the airwaves and the UK resumed television transmission after the war, broadcasting on multiples of the gyroharmonic above the second which causing a major shift in the electron density of the polar region, pressure systems to alter and the electron precipitation to calm.
As the ozone layer began to repair itself and the temperature dropped all the water vapor that had been building in the atmosphere up until this time now began to condense causing rain and freak snow storms ravaged parts of the United States and Europe. This was one of the strangest storms in history and it began with an anticyclone that centered in central Scandinavia. The UK broadcast television incurred massive tropospheric ducting and the signals were received all over the world.
“Tropospheric propagated signals travel in the part of the atmosphere adjacent to the surface and extending to some 25,000 feet (7,620 meters). Such signals are thus directly affected by weather conditions extending over some hundreds of miles. During very settled, warm anticyclonic weather (i.e., high pressure), usually weak, snowy TV signals from distant transmitters improve in signal strength.
A settled high-pressure system gives the classic conditions for enhanced tropospheric propagation, in particular favouring signals which travel along the prevailing isobar pattern rather than across it. Such weather conditions can occur at any time, but generally the summer and autumn months are the best periods. In certain favourable locations, enhanced tropospheric propagation may enable reception of UHF TV signals up to 1,000 miles (1,600 km) or more.” (Page 95)
Arctic Ozone Depletion Linked to Longevity of Polar Stratospheric Clouds - Click & go
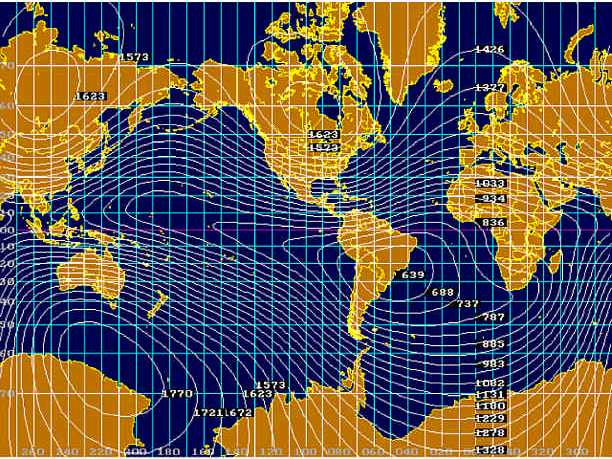
Gyro frequency map
The Ionosphere is sensitive to Gyro frequency produced by AM 1400MHz broadcast
Notice that the gyrofrequency path is right over Greenland's ice sheets which are melting quickly!
The broadcast gyrofrequency fuels the aurora electrojet and the electron density in the polar cap region.
Next click here
Broadcast History
Research Sections
Next click here
Broadcast History
As the ozone layer thins it allows more solar UV radiation to heat the ocean water increasing evaporation and creating more water vapor which is heated by UV along with other greenhouse gases like CO2 in a global greenhouse effect

Next click here
Broadcast History
Next click here
Broadcast History
Click here to add text.

1.Both experimental and model studies of long-term climate changes above Antarctica continent indicate presence of strong climate warming at the region around the Antarctic peninsula which differs significantly from the climate tendency in other parts of Antarctica. This warming is the most intense on the Earth together with similar regions of warming located in Alaska and in North-East Siberia. Another climatic anomaly in this region is a giant spot of the open water (polynya) which does not freeze in wintertime. Up to now all attempts to explain these phenomena by the traditional meteorological factors turned out to be inadequate.
2. It is shown in this paper that the region of intense global warming around Antarctic peninsula precisely coincides with a stable maximum of energetic electron precipitation (E > 1 MeV) from the Earth radiation belt. Depth of penetration of these particles into atmosphere could be as low as 20-40 km.
3. Energetic resources of this phenomenon are quite sufficient in order to supply input of thermal energy capable to warm atmosphere in this region.
4. Further study of interaction between the auroral and mid-latitude atmospheres during geomagnetic storms and superstorms is an important part of the solar-terrestrial physics. There are a lot of things to be done in this direction.
Source: http://www.cosis.net/abstracts/EMS2006/00027/EMS2006-A-00027.pdf?PHPSESSID=3
Peculiarities of Long-Term Trends of Surface Temperature in Antarctica and Their Possible Connections with Outer Belt Electron Precipitation
Click to Enlarge
EEP-NOx: Missing driver in the Sun–Earth connection from energetic electron precipitation impacts mesospheric ozone
"Energetic electron precipitation (EEP) from the Earth's outer radiation belt continuously affects the chemical composition of the polar mesosphere. EEP can contribute to catalytic ozone loss in the mesosphere through ionization and enhanced production of odd hydrogen. However, the long-term mesospheric ozone variability caused by EEP has not been quantified or confirmed to date.
Here we show, using observations from three different satellite instruments, that EEP events strongly affect ozone at 60–80 km, leading to extremely large (up to 90%) short-term ozone depletion. This impact is comparable to that of large, but much less frequent, solar proton events. On solar cycle timescales, we find that EEP causes ozone variations of up to 34% at 70–80 km. With such a magnitude, it is reasonable to suspect that EEP could be an important part of solar influence on the atmosphere and climate system.

An assessment of southern hemisphere stratospheric NOx enhancements due to transport from the upper atmosphere:
Up to half of the NOx in the mid‐stratospheric SH polar vortex may be due to particle precipitation.
https://agupubs.onlinelibrary.wiley.com/doi/abs/10.1029/1999GL010940
Additional Research:
Nitrous Oxide Now Top Ozone-depleting Emission Date: August 28, 2009
Source: National Oceanic And Atmospheric Administration
Summary: Nitrous oxide has now become the largest ozone-depleting substance emitted through human activities, and is expected to remain the largest throughout the 21st century, scientists report in a new study.
https://www.sciencedaily.com/releases/2009/08/090827141344.htm